Anritsu MS2090A series of portable spectrum analyzers

Brief description of the series
The Anritsu MS2090A Field Master Pro series of spectrum analyzers consists of seven models of high-quality portable instruments that are distinguished by the upper frequency range (from 9 GHz to 54 GHz). Analyzers in this series have excellent accuracy, low intrinsic noise and distortion, and high signal processing speed.
When equipped with the appropriate option, each MS2090A series model can contain a real-time spectrum analyzer with an analysis bandwidth from 22 MHz to 150 MHz. In addition, with the appropriate option, the MS2090A series analyzers can demodulate and analyze the latest 4G and 5G wireless standards with a channel width of up to 150 MHz. For detailed differences between the series models, see the interactive table. A full description of all the characteristics can be downloaded below on this page in the Documentation section.
All models of the series
The Anritsu MS2090A series consists of seven models, which are presented in this interactive table. To see all the characteristics of certain models, add them to the comparison.
| Model |
Maximum frequency
|
Signal analysis bandwidth
|
Real-time analysis bandwidth
|
Average noise DANL
|
Weight
|
|---|---|---|---|---|---|
| 9 GHz | 22 MHz 55 MHz 120 MHz 150 MHz | 22 MHz 55 MHz 120 MHz 150 MHz | -161 dBm -164 dBm | 5.06 kg | |
|
Top sales
|
14 GHz | 22 MHz 55 MHz 120 MHz 150 MHz | 22 MHz 55 MHz 120 MHz 150 MHz | -161 dBm -164 dBm | 5.06 kg |
|
Expert's choice
|
20 GHz | 22 MHz 55 MHz 120 MHz 150 MHz | 22 MHz 55 MHz 120 MHz 150 MHz | -161 dBm -164 dBm | 5.06 kg |
| 26.5 GHz | 22 MHz 55 MHz 120 MHz 150 MHz | 22 MHz 55 MHz 120 MHz 150 MHz | -161 dBm -164 dBm | 5.4 kg | |
| 32 GHz | 22 MHz 55 MHz 120 MHz 150 MHz | 22 MHz 55 MHz 120 MHz 150 MHz | -161 dBm -164 dBm | 5.4 kg | |
|
Expert's choice
|
43.5 GHz | 22 MHz 55 MHz 120 MHz 150 MHz | 22 MHz 55 MHz 120 MHz 150 MHz | -161 dBm -164 dBm | 5.4 kg |
| 54 GHz | 22 MHz 55 MHz 120 MHz 150 MHz | 22 MHz 55 MHz 120 MHz 150 MHz | -161 dBm -164 dBm | 5.4 kg |
Main features of the series
Frequency: 9 kHz – 9 GHz (model MS2090A-0709).
Frequency: 9 kHz – 14 GHz (model MS2090A-0714).
Frequency: 9 kHz – 20 GHz (model MS2090A-0720).
Frequency: 9 kHz – 26.5 GHz (model MS2090A-0726).
Frequency: 9 kHz – 32 GHz (model MS2090A-0732).
Frequency: 9 kHz – 43.5 GHz (model MS2090A-0743).
Frequency: 9 kHz – 54 GHz (model MS2090A-0754).
Resolution (RBW): 1 Hz – 10 MHz. Signal analysis bandwidth: up to 150 MHz (option).
Amplitude: +30 dBm to -164 dBm. Noise: -164 dBm (typical value).
Amplitude measurement accuracy up to 14 GHz: ±0.5 dB (typical value).
Built-in preamp over the entire frequency range (for all models).
Real-time analysis bandwidth: 22 MHz (option 0199), 55 MHz (option 0199 + option 0103), 120 MHz (option 0199 + option 0104), 150 MHz (option 0199 + option 0105).
Demodulation and quality analysis of wireless communication standards: 5G (option 0888), LTE (option 0883) and WCDMA (option 0871).
Standard measurements: channel power, occupied bandwidth, adjacent channel power ratio (ACPR), signal mask measurement, RSSI, time-frequency diagram (spectrogram), direction finder mode and others.
25.7 cm impact-resistant touchscreen (1280 × 800 resolution).
Operating time from the built-in accumulator: 2 hours (typical value). Interfaces: Ethernet 1G, USB3, Wi-Fi.
Weight: up to 5.4 kg. Dimensions: 314 × 235 × 95 mm. Operating temperature: from -10°С to +55°С.
In addition, Anritsu produces a series of handheld spectrum analyzers: MS2720T (up to 43 GHz). This series cannot perform real-time spectrum analysis and performs demodulation and analysis of wireless signals with a channel width of no more than 20 MHz, but it supports all major 2G, 3G and 3G+ standards: GSM/GPRS/EDGE, W-CDMA/HSPA+, LTE/ LTE-A FDD/TDD, CDMA/EV-DO, WiMAX Fixed/Mobile, TD-SCDMA and others.
Need an ultra-portable analyzer up to 170 GHz? See the Anritsu MS276xA series.
Need a powerful benchtop spectrum analyzer? See the Anritsu MS2830A series.
Need the lowest phase noise? See the Anritsu MS2840A series.
Need a cheaper analyzer? See the Anritsu MS271xE series.
Need a real-time lab spectrum analyzer? See the Tektronix RSA5000B series.
Need a spectrum analyzer combined with an oscilloscope? See the Tektronix MDO3 series.
Want to see the full list? This page has everything to buy a spectrum analyzer.
Video review of Anritsu MS2090A when analyzing Bluetooth and Wi-Fi
This video review shows the operation of the Anritsu MS2090A real-time spectrum analyzer when analyzing the structure of Bluetooth and Wi-Fi signals at frequencies from 2.4 GHz to 2.5 GHz. An operating microwave oven is used as an interference signal. The operation of the Bluetooth adaptive frequency hopping algorithm in the presence of an interfering Wi-Fi signal and powerful broadband interference is clearly visible.
Multiple analyzers in one instrument
The Anritsu MS2090A Field Master Pro series analyzers have many operating modes: classic scanning spectrum analyzer, real-time spectrum analyzer (RTSA), interference hunter, channel scanner, 5G analyzer, LTE analyzer, WCDMA analyzer, pulse analyzer, electromagnetic field meter, high accuracy power meter, antenna analyzer and others. The operating mode is selected in the analyzer's main menu. Each mode supports its own types of measurements and the corresponding menu structure. The main capabilities of these modes are shown below on this page.

Classic spectrum analysis mode
The large display on the Anritsu MS2090A Field Master Pro analyzers allows you to simultaneously view up to six spectral lines (traces), each of which can use its own detector type and its own accumulation or averaging mode.
The screenshot below shows a single RF signal with a 50 MHz bandwidth, but measured in three different ways. The first graph (yellow) uses the peak detector and the maximum accumulation mode. The second graph (green) uses the average detector and the 10-measurement averaging mode. The third graph (blue) uses the peak detector and the minimum accumulation mode. This way, you can easily see the range of the signal amplitude variation.

To measure the spectral characteristics of radio signals, you can activate up to 12 markers and a table of values containing detailed information about each marker. There are four types of markers: normal, delta marker, noise marker and frequency counter marker. The user also has the means to automate work with markers: search for maximum, minimum, placement of markers on harmonics, etc.
This screenshot shows a section of the spectrum in the range from 0 Hz to 1 GHz. There are five markers at the peaks of the radio signals found: four regular markers and one delta marker. The exact values of the frequencies and powers of each marker are given in the table at the bottom of the analyzer screen.

All Anritsu MS2090A Field Master Pro series signal and spectrum analyzers support the display of a continuous sequence of spectra as a spectrogram as standard. This mode, which is also called a time-frequency diagram, is very useful for finding intermittent signal sources or interference, as well as for tracking the amplitude and frequency drift of radio sources.
This screenshot from the Anritsu MS2090A analyzer shows a 122 MHz spectrum section. At the bottom of the screen is a spectrogram containing 130 consecutive measurements of the spectrum of this section. The total measurement time of 130 spectra in this case is 4.54 seconds. There are two markers on the spectrogram: C1 (on the 41st spectrum) and C2 (on the 88th spectrum). The two spectra corresponding to these markers are shown at the top of the screen (yellow for C1 and green for C2).

Real-time spectrum analysis
The MS2090A series models are standard scanning spectrum analyzers. With the MS2090A-0199 option, they gain the ability to analyze the spectrum in real time with a bandwidth of 22 MHz. With the MS2090A-0199 and MS2090A-0103 options, the analysis bandwidth is 55 MHz. With the MS2090A-0199 and MS2090A-0104 options, the analysis bandwidth is 120 MHz. And with the MS2090A-0199 and MS2090A-0105 options, the real-time analysis bandwidth is 150 MHz. This screenshot shows a continuous 150 MHz wide section of the spectrum analyzed in real time.

This mode is useful for analyzing rapidly changing signals such as frequency hopping, detecting short pulses lasting a few microseconds or searching for sources of transient interference. This mode is also used for TIP (technical information protection) tasks.
As an example, the figure below shows a screenshot of the MS2090A screen analyzing the spectrum in the frequency range from 2.4 GHz to 2.5 GHz. The screenshot clearly shows the structure of the Bluetooth scanning signal transmitted from the smartphone in the search mode for other Bluetooth devices. A Wi-Fi signal is transmitted in the same frequency range, in the center of which there is stationary interference (a small green peak with a red dot in the center).

Limit lines can be used to further automate spectrum analysis in both classic and real-time modes. When the measured signal crosses the limit line, the analyzer can save the measurement results to memory or perform another action. This is useful in the case of intermittent interference, when the user can set the limit line and automatically capture the required information when it is crossed. This function is also useful for incoming control of radio frequency devices for compliance with specified parameters. For example, this screenshot shows a limit line consisting of nineteen segments (the green line along the upper edge of the spectrum).

Search for interference sources
The presence of the MS2090A-0024 option and the additional Anritsu MA2700A Interference Hunter antenna holder greatly simplifies the search for radio signal sources. The Anritsu MA2700A antenna holder connects to a spectrum analyzer via USB, contains a GPS receiver, an electronic compass and a preamplifier with an on/off button. This photo shows the exterior of the MA2700A Interference Hunter along with the MS2090A series analyzer.

Option MS2090A-0024 includes AM/FM audio demodulation of interference signals, audio signal for interference direction finding and geolocation of interference sources on a digital map. This screenshot shows the analyzer screen with a map of the area, on which the location of the signal source is marked using three bearings.

Channel scanner
The presence of the MS2090A-0027 option allows you to work with the analyzer in channel scanner mode, with which you can display the power of up to 20 channels on one screen or up to 60 channels on several pages. Channels can have a regular frequency increment or can be set to any combination of frequencies and spans. A screenshot of the analyzer screen in channel scanner mode is shown below.

5G network analysis
If the Anritsu MS2090A analyzer has the MS2090A-0888 option installed, then the ability to demodulate and analyze fifth-generation wireless networks (5G) signals is activated. In this mode, the Anritsu MS2090A spectrum analyzer can measure all key parameters of wireless radio signals, which allows you to optimize your network structure and quickly identify and fix problems that arise during its operation.

One of the features of 5G networks is the use of multi-sector antennas and dynamic coverage optimization technology (Beamforming). The Anritsu MS2090A series analyzers can simultaneously measure key parameters of up to 64 radio beams, which is more than enough to solve any practical problems. This screenshot shows the MS2090A screen, which displays the SS-RSRP, SS-RSRQ, SS-SINR, and SS-RSSI parameters of eight individual beams of sector number 560.

LTE network analysis
If the Anritsu MS2090A analyzer has the MS2090A-0883 option installed, then the ability to demodulate and analyze LTE FDD/TDD wireless network signals is activated. These measurements are performed to increase the speed and reliability of data transmission by monitoring and adjusting key network parameters. This screenshot shows one such measurement: checking the modulation quality of the transmitted signal with the display of the constellation diagram.

This screenshot shows an example of plotting the signal level on a floor plan with color-coded signal strength. In this case, the power measurement of the LTE channel with a center frequency of 751 MHz is used.

Case design
On the side of the Anritsu MS2090A series analyzer case, under the protective cover, are various communication connectors: a USB 3.0 port, a USB Type C port, a 1G Ethernet port, a PCIe port for streaming data, a slot for installing a microSD card, a standard audio output for headphones, and a connector for connecting an external power supply.

All RF connectors of the MS2090A series analyzers are located on the top of the device case. This is very convenient when working on site: the connected cables do not interfere with the operator. The 9 GHz, 14 GHz and 20 GHz models use a standard N(f) input connector. The 26.5 GHz, 32 GHz and 43.5 GHz models use a ruggedized high-frequency K(m) connector. And the 54 GHz model uses a ruggedized high-frequency V(m) connector. Also on the top side of the case are: an input for connecting a GPS antenna, an output of a constant voltage source (Bias Voltage), an input and output of a reference frequency signal, an input and output of a synchronization signal, an output of an intermediate frequency (IF Out) and two USB ports for connecting flash drives.
Additional accessories
-
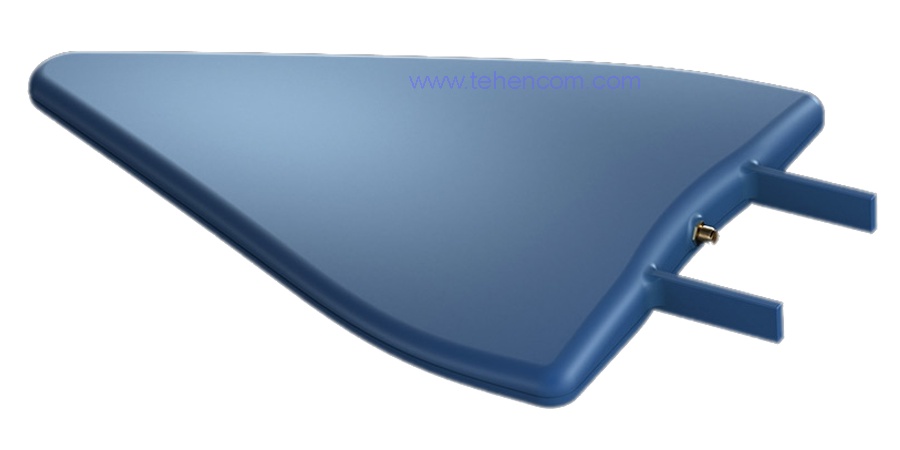
Directional log periodic antenna. Frequency range from 680 MHz to 18 GHz. Typical gain 5 dBi. Connector SMA(f). Dimensions: 340 x 200 x 25 mm. Weight 250 grams.
From 111 804 UAH
-
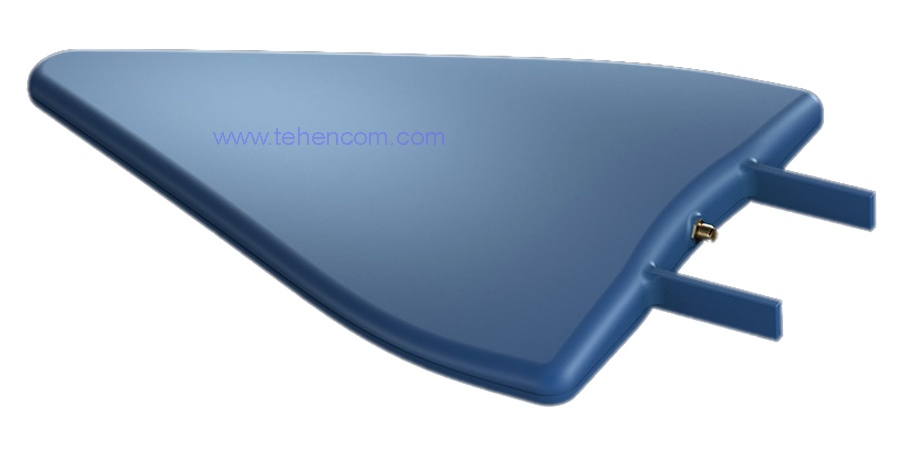
Directional log periodic antenna. Frequency range from 700 MHz to 6 GHz. Typical gain 5 dBi. Connector SMA(f). Dimensions: 340 x 200 x 25 mm. Weight 270 grams.
From 33 804 UAH
-
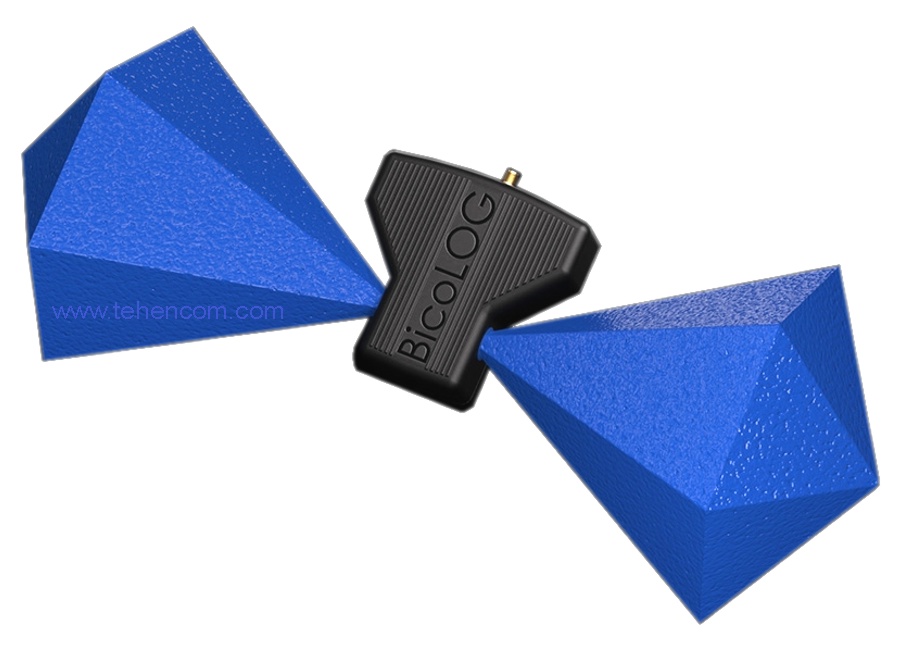
Directional biconical antenna. Frequency range from 30 MHz to 1 GHz. Typical gain from -39 dBi to 1 dBi. Connector SMA(f). Dimensions: 350 x 160 x 140 mm. Weight 350 grams.
From 54 600 UAH
-
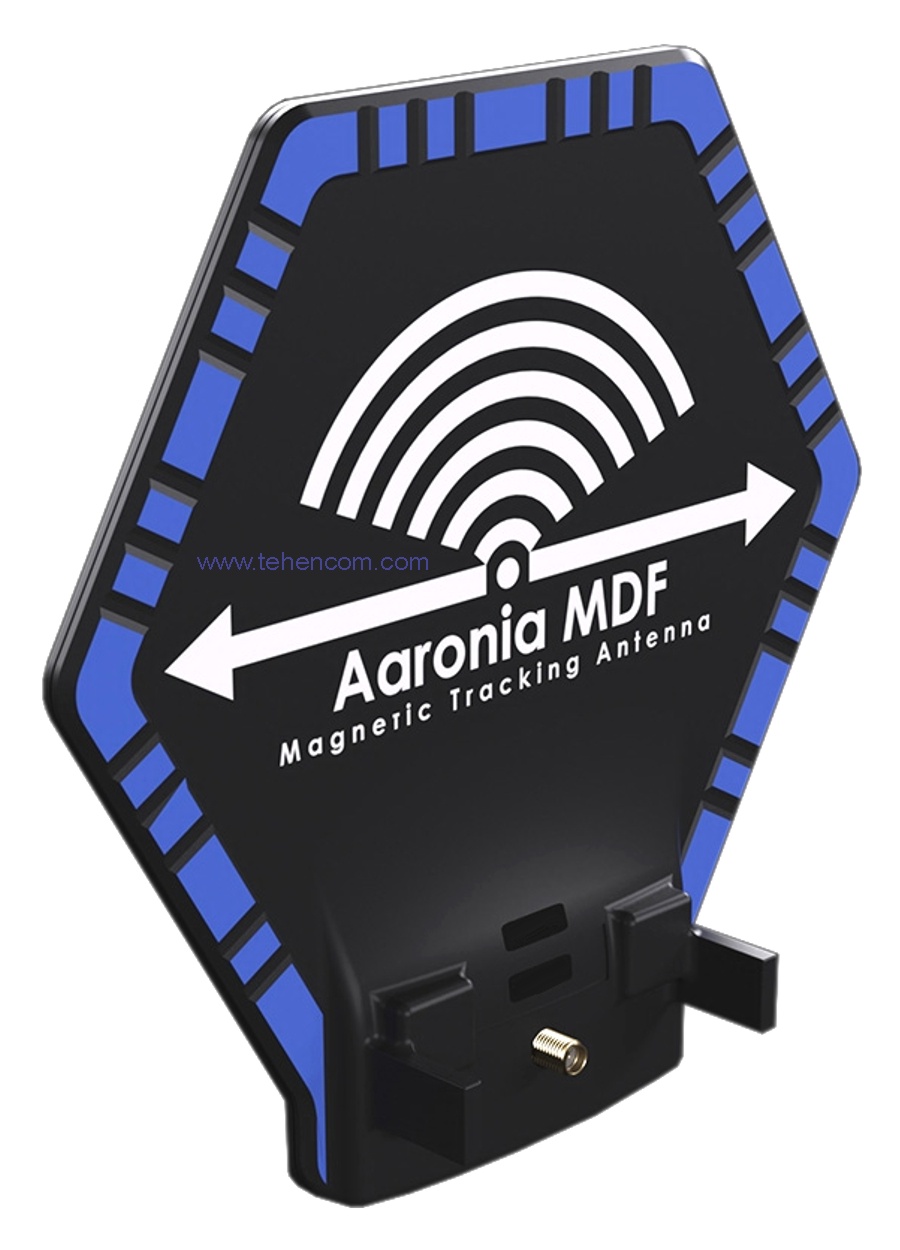
Directional passive loop antenna for magnetic field. Frequency range from 9 kHz to 400 MHz. Maximum gain -60 dBi. Connector SMA(f). Dimensions: 180 x 180 x 50 mm. Weight 180 grams.
From 46 800 UAH
-
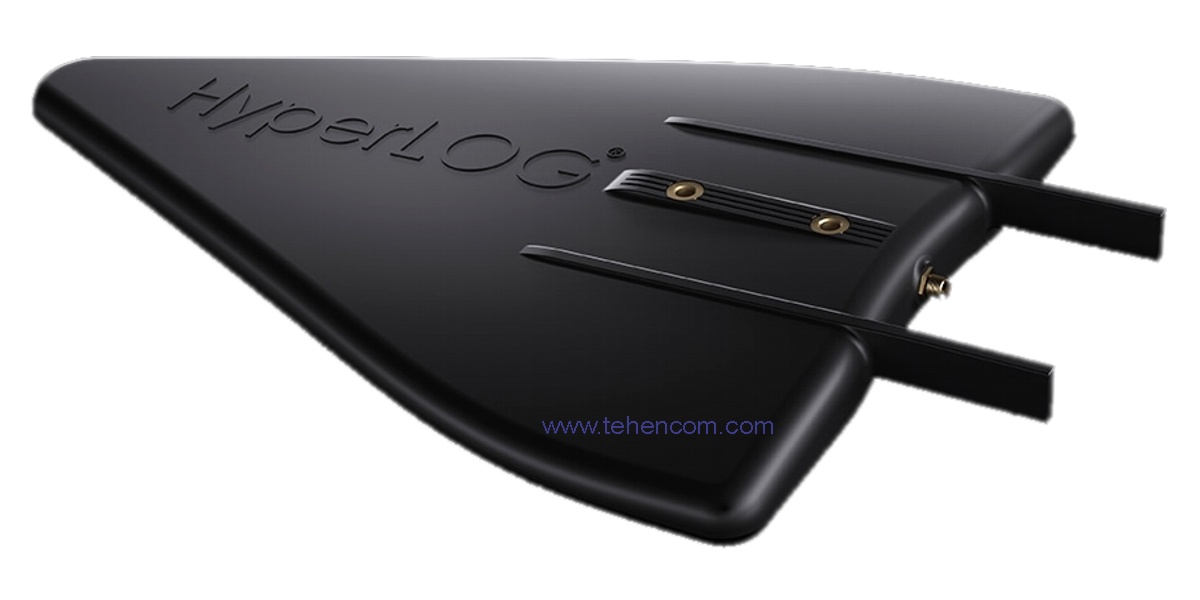
Directional log periodic antenna. Frequency range from 2 GHz to 40 GHz. Typical gain 12 dBi. Connector K(f). Dimensions: 340 x 200 x 25 mm. Weight 250 grams.
From 217 362 UAH
-
Directional log periodic antenna. Frequency range from 2 GHz to 30 GHz. Typical gain 11 dBi. Connector K(f). Dimensions: 340 x 200 x 25 mm. Weight 250 grams.
From 154 440 UAH
-
Directional log periodic antenna. Frequency range from 2 GHz to 20 GHz. Typical gain 11 dBi. Connector K(f). Dimensions: 340 x 200 x 25 mm. Weight 250 grams.
From 114 402 UAH
-
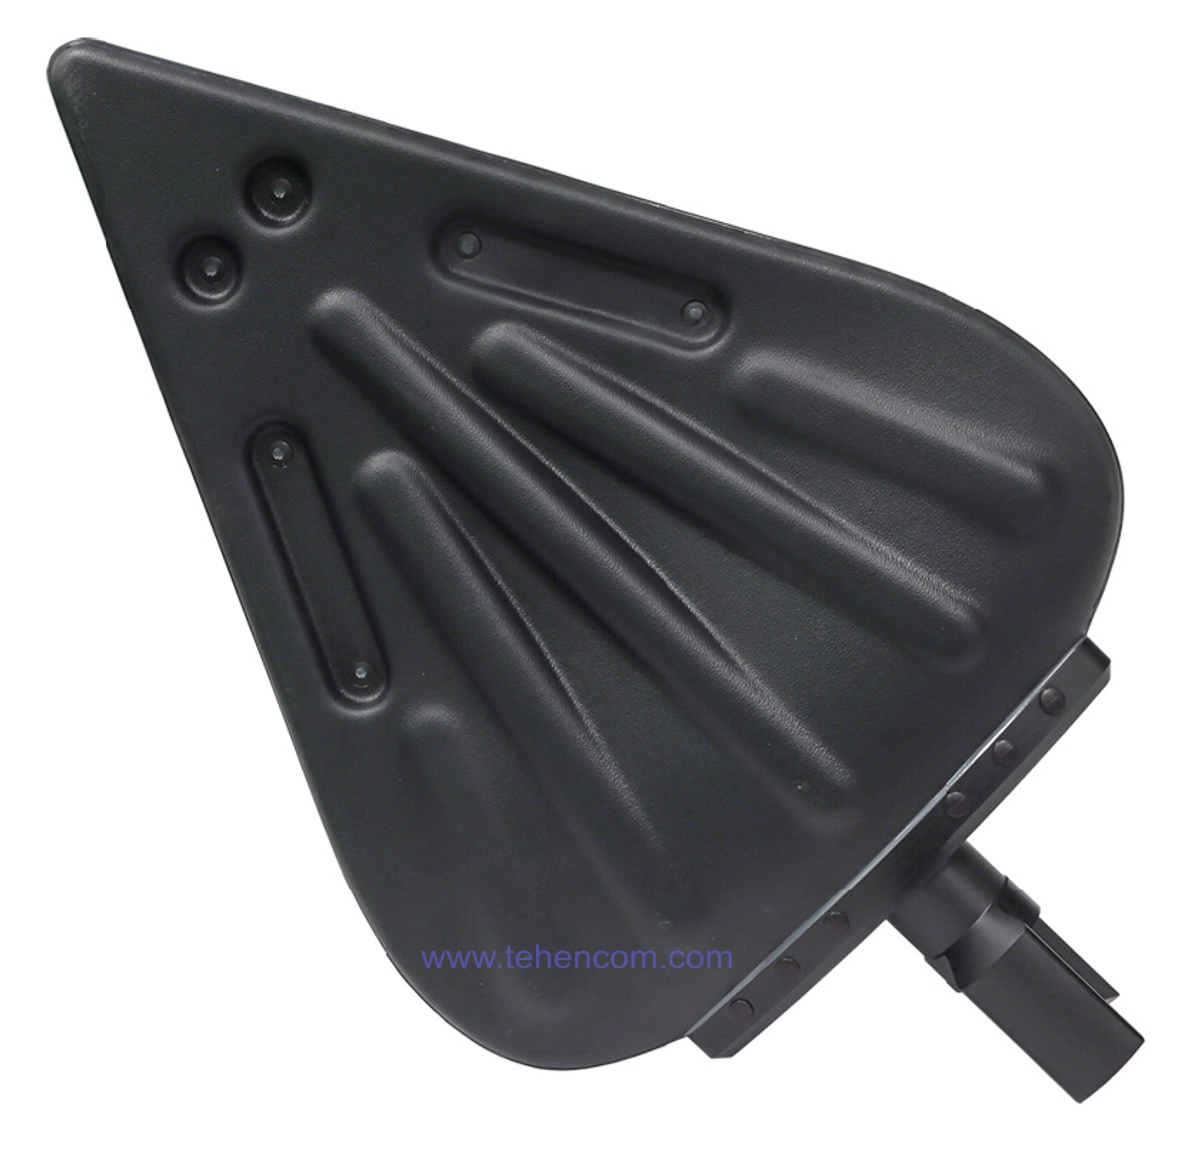
Hybrid log periodic antenna. Frequency range from 20 MHz to 8.5 GHz. Connector N(f). Dimensions: 500 x 320 x 60 mm. Weight 1.8 kg.
Price on request
-

Handheld direction finding system with preamplifier (9 kHz – 6 GHz), GPS receiver and electronic compass. Connector N(m). Dimensions: 303 x 220 x 70 mm. Weight 990 grams.
Price on request
-
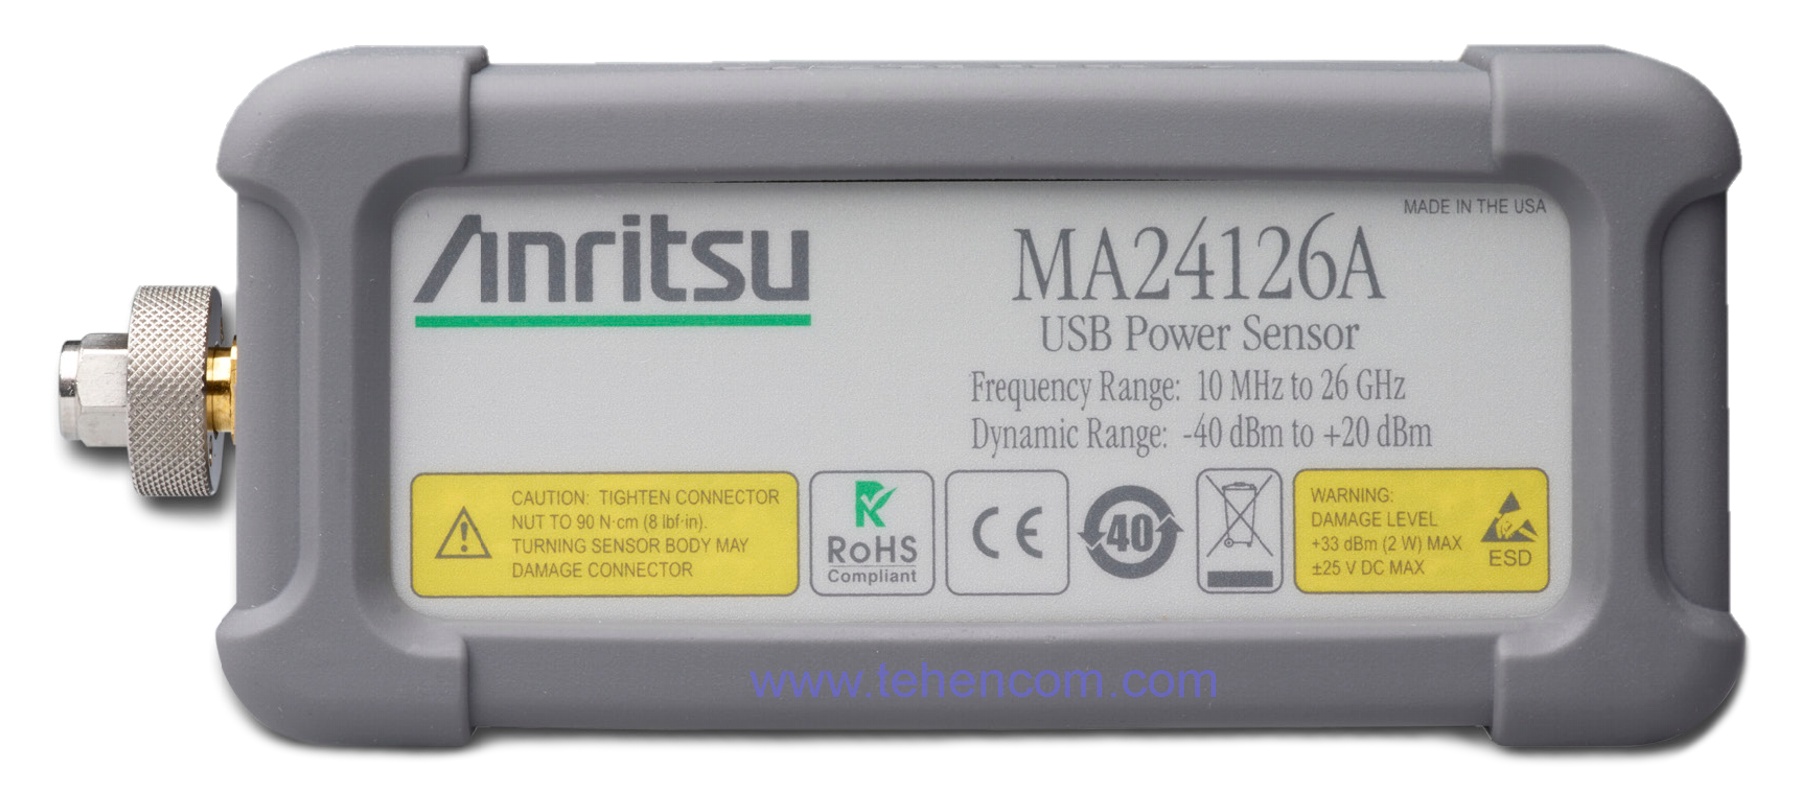
Power sensor for RF and microwave signals. Frequency range from 10 MHz to 26 GHz. Measurement range from -40 dBm to +20 dBm. Typical accuracy 0.3 dB. VBW 50 kHz. Connector K(m). Dimensions: 110 x 45 x 25 mm. Weight 230 grams.
Price on request
-
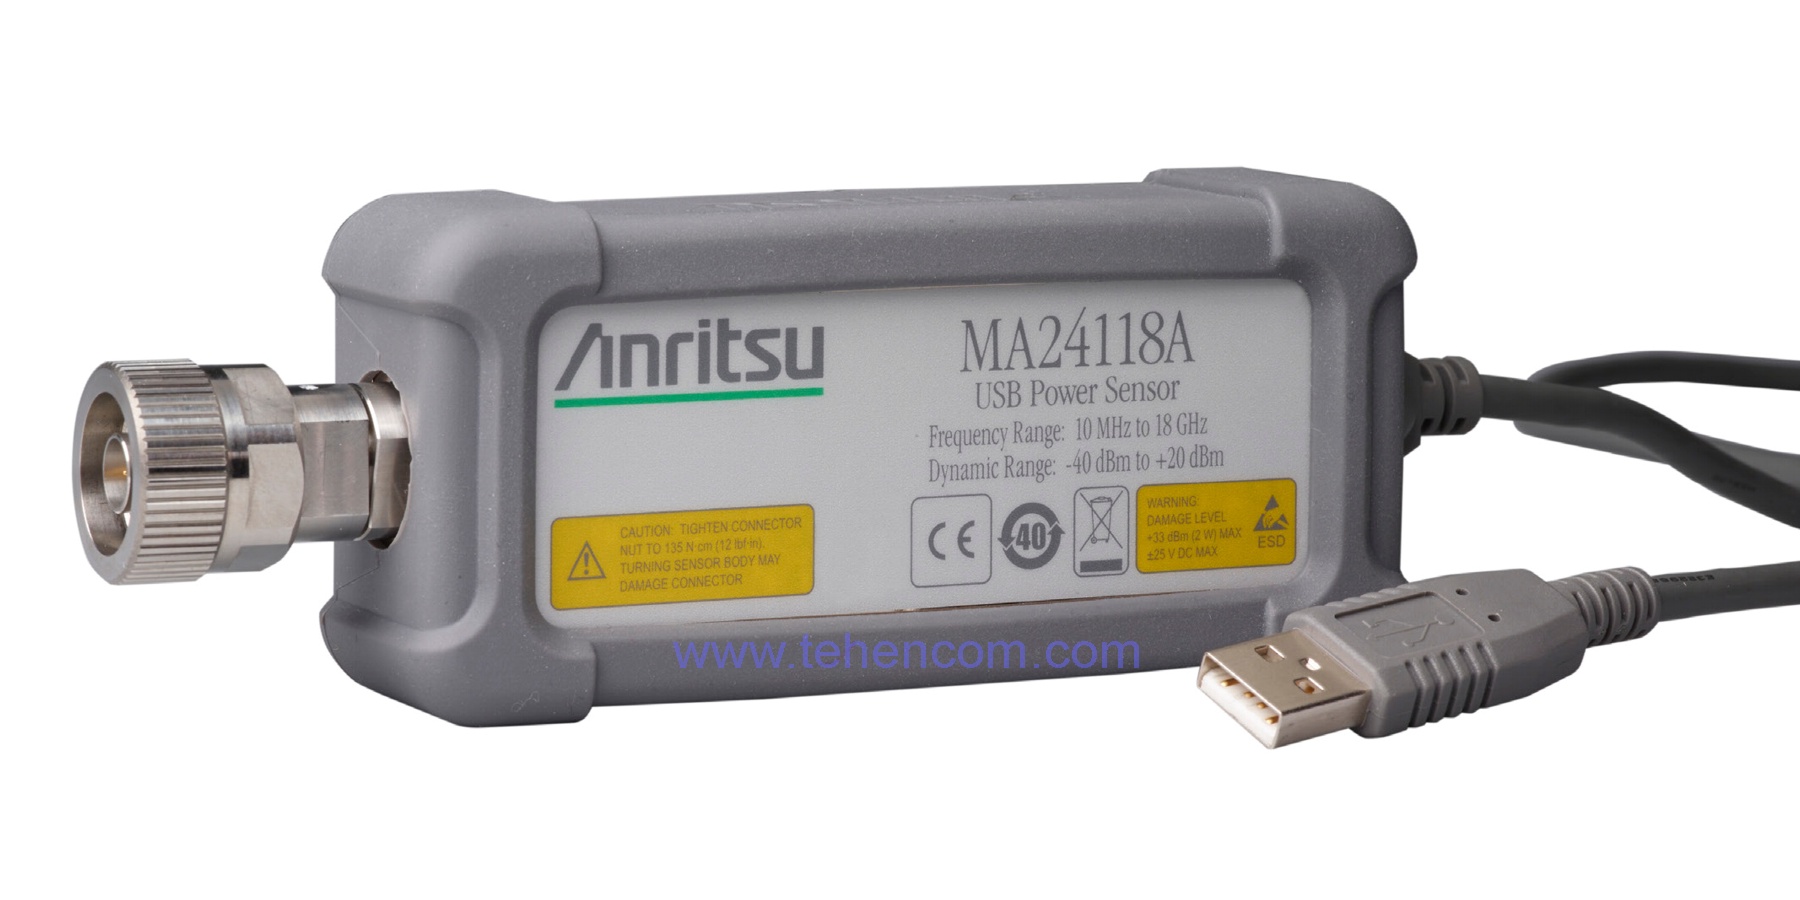
Power sensor for RF and microwave signals. Frequency range from 10 MHz to 18 GHz. Measurement range from -40 dBm to +20 dBm. Typical accuracy 0.25 dB. VBW 50 kHz. Connector N(m). Dimensions: 110 x 45 x 25 mm. Weight 230 grams.
From 291 360 UAH
-
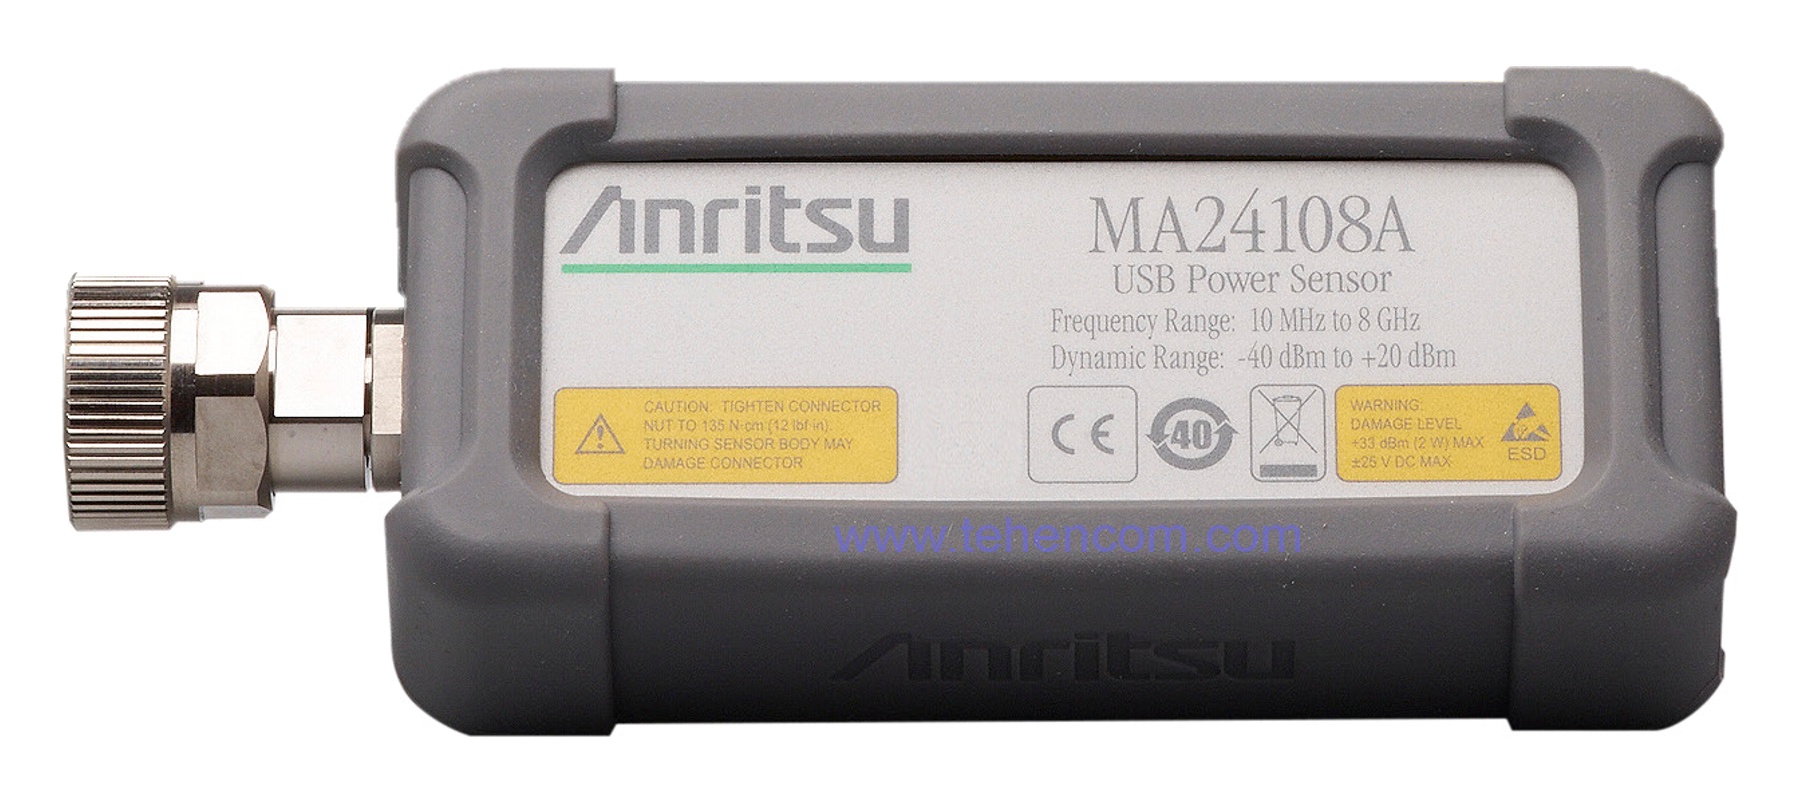
Power sensor for RF and microwave signals. Frequency range from 10 MHz to 8 GHz. Measurement range from -40 dBm to +20 dBm. Typical accuracy 0.25 dB. VBW 50 kHz. Connector N(m). Dimensions: 110 x 45 x 25 mm. Weight 230 grams.
From 259 224 UAH
-
 Product code: 1080003Aaronia 501/053On order Expert's choice
High frequency cable. Connectors SMA(m) – SMA(m). Length 2 meters. Up to 26 GHz, 50 Ohm. Attenuation 2.6 dB/m. Maximum VSWR at 6 GHz: 1.1. Convenient plastic nuts.
From 9 360 UAH
-
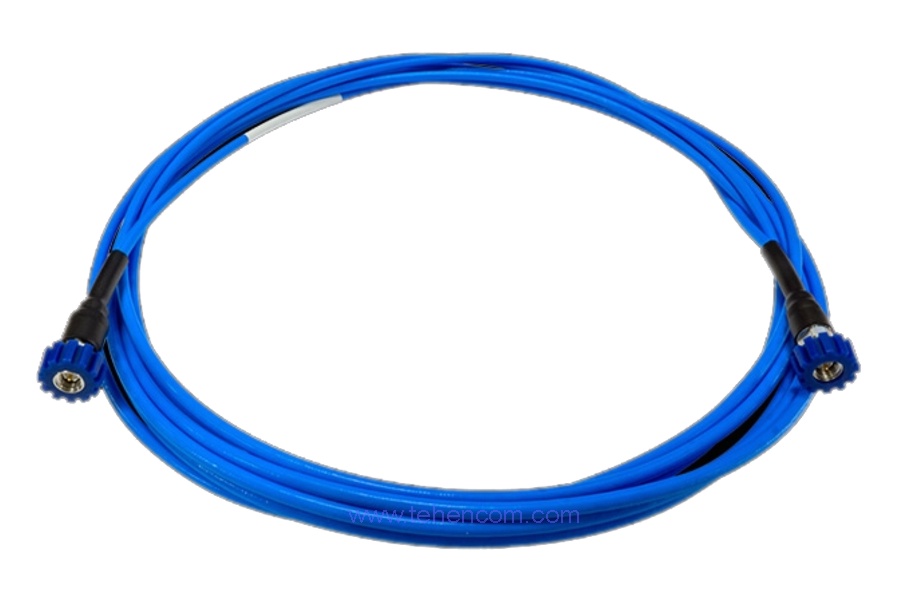 Product code: 1080004Aaronia 501/054On order
High frequency cable. Connectors SMA(m) – SMA(m). Length 5 meters. Up to 26 GHz, 50 Ohm. Attenuation 2.6 dB/m. Maximum VSWR at 6 GHz: 1.1. Convenient plastic nuts.
From 13 524 UAH
-
 Product code: 1080005Aaronia 501/055On order
High frequency cable. Connectors SMA(m) – SMA(m). Length 10 meters. Up to 26 GHz, 50 Ohm. Attenuation 2.6 dB/m. Maximum VSWR at 6 GHz: 1.1. Convenient plastic nuts.
From 17 160 UAH
-
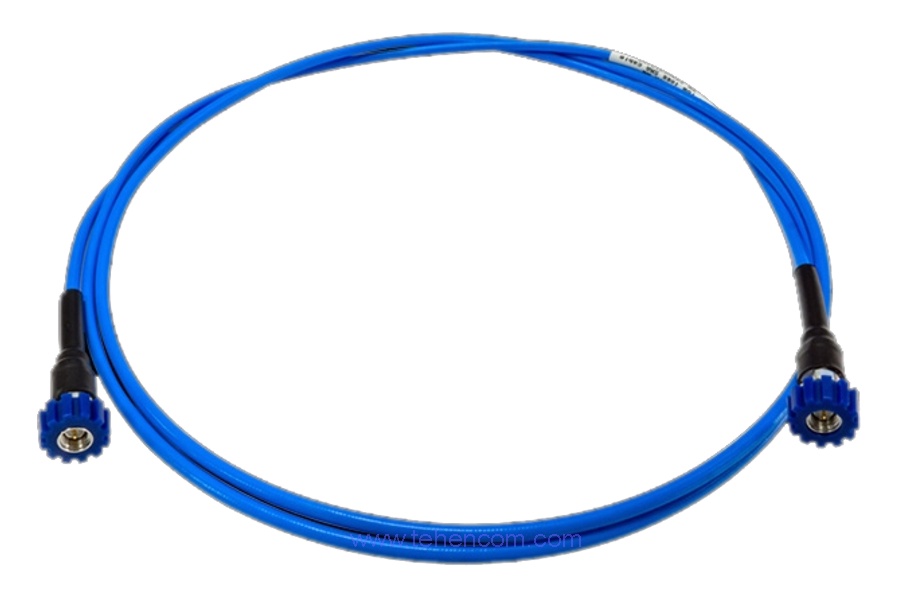
 Product code: 1080002Aaronia 501/006On order Top sales
High frequency cable. Connectors SMA(m) – SMA(m). Length 1 meter. Up to 6 GHz, 50 Ohm. Attenuation at 6 GHz: 3 dB/m. Maximum VSWR at 6 GHz: 1.3. Convenient plastic nuts.
From 2 238 UAH
-
 Product code: 1080001Aaronia 502/009On order
High frequency adapter. Connectors SMA(f) – N(m). Up to 18 GHz, 50 Ohm. Dimensions: 30 x 20 x 20 mm.
From 1 872 UAH


Documentation and useful materials
-
Briefly about the Anritsu MS2090A series
EN, 2 pages, 1 MB
-
Description of the Anritsu MS2090A series
EN, 34 pages, 26 MB
-
Characteristics of the Anritsu MS2090A series
EN, 41 pages, 7 MB
-
User guide of the Anritsu MS2090A series
EN, 124 pages, 12 MB
-
Programming manual of the Anritsu MS2090A series
EN, 398 pages, 3 MB
-
Measurement guide in spectrum analyzer mode
EN, 172 pages, 15 MB
-
Measurement guide in real time mode
EN, 100 pages, 7 MB
-
Measurement guide in cable and antenna analyzer mode
EN, 112 pages, 13 MB
-
Measurement guide in high accuracy power meter mode
EN, 32 pages, 2 MB
-
Measurement guide in channel scanner mode
EN, 34 pages, 3 MB
-
Measurement guide in 5GNR analyzer mode
EN, 112 pages, 10 MB
-
Measurement guide in LTE FDD/TDD analyzer mode
EN, 104 pages, 9 MB
-
Measurement guide in WCDMA analyzer mode
EN, 58 pages, 5 MB
-
Measurement guide in IQ capture and streaming mode
EN, 18 pages, 2 MB
-
Measurement guide in pulse analyzer mode
EN, 48 pages, 4 MB
-
Measurement guide in electromagnetic field meter mode
EN, 18 pages, 2 MB