USB real-time spectrum analyzer up to 6.2 GHz Tektronix RSA306B
Product code: 1000015
Add item to cart. Our specialist will coordinate with you the complete set, tell you the price and delivery time.
Price on request
Short description
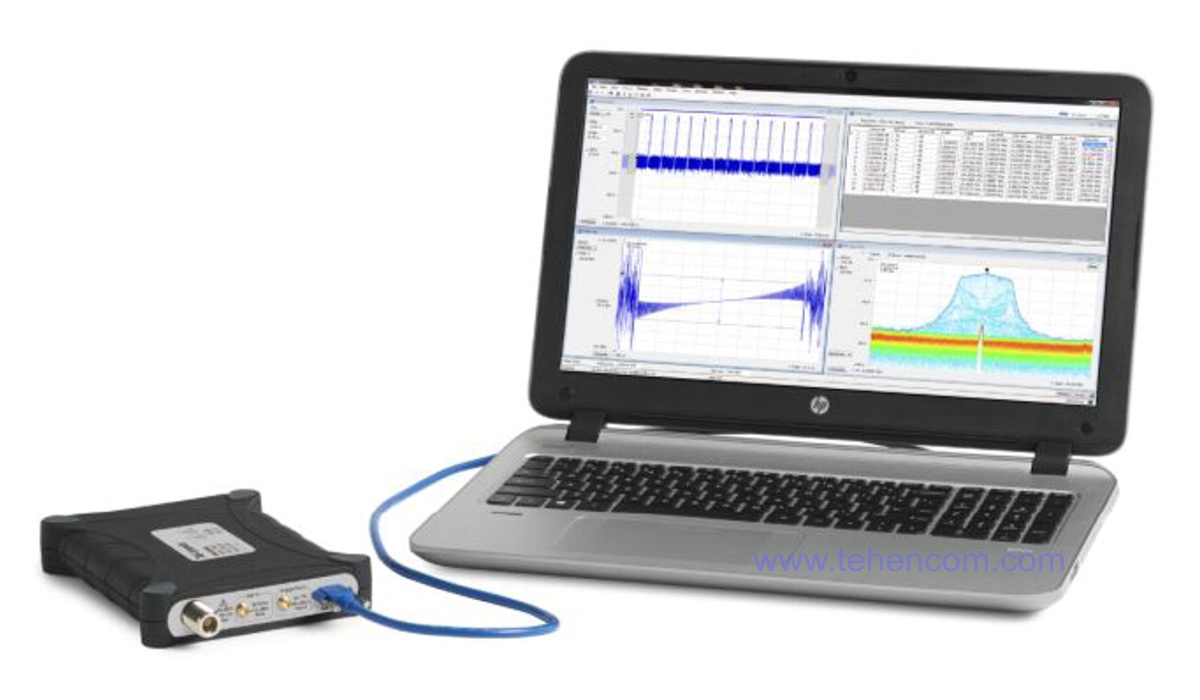
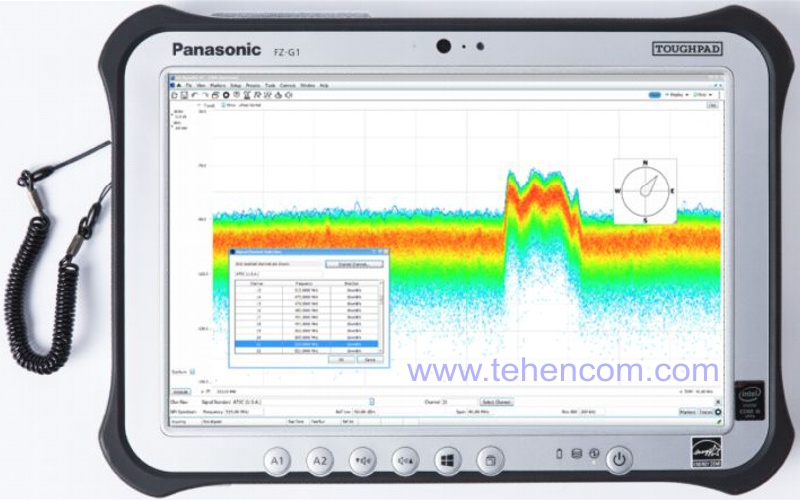
Handheld spectrum analyzer and real-time signals Tektronix RSA306B is an upgraded version of the popular USB Spectrum Analyzer RSA306. The Tektronix RSA306B spectrum analyzer is controlled by a free program Tektronix SignalVu-PC, which is installed on a separate personal computer or tablet.
The Tektronix RSA306B is designed for real-time spectrum and signal analysis (up to 10,000 spectrograms per second), streaming data capture, and deep analysis of pulsed signals from 9 kHz to 6.2 GHz. This impressive feature set helps to reduce costs and deliver a low cost, portable solution ideal for use in the field, manufacturing and research. You can download a full description of all the characteristics of this analyzer below on this page in the section Documentation.
Main features
Frequency: 9 kHz - 6.2 GHz.
Real-time capture bandwidth: 40 MHz. Up to 10,000 spectrograms per second.
The minimum duration of an event detected with a probability of 100%: up to 100 µs.
Amplitude: +20 dBm to -131 dBm. Noise: -131 dBm.
17 standard measurements for spectrum analysis and pulse signals.
Comprehensive spectrum analysis with the free Tektronix SignalVu-PC software.
Work with the spectrum in real time to search for transients and interference.
Capture streaming data for long-term recording on a computer.
Additional options: direction finding, modulation analysis (AM, FM, PM, OFD, etc.), wireless protocol analysis (LTE, WLAN, Bluetooth, P25, etc.), pulse measurements, frequency settling time and signal phase measurement.
Withstands harsh operating conditions (Mil-Std 28800 Class 2 standard).
Interfaces: USB 3.0. Operating temperature range: from -10°С to +55°С. Weight: 0.75 kg.
Areas of use:
- basic spectrum analysis both from the air and when directly connected to the source;
- search for sources of interference, including short-term (up to 100 µs) and non-stationary ones;
- installation, maintenance and repair of equipment at the plant or at the site of operation;
- development and production of components , modules and systems with an optimal price-quality ratio;
- scientific research;
- training in universities.
The Tektronix RSA306B allows you to perform detailed spectrum analysis and in-depth analysis of pulsed signals at a competitive price. Significant savings are achieved due to the fact that the analyzer itself only captures the signal, and all processing is carried out using a computer or a powerful tablet. For data transfer, a high-speed USB 3.0 interface is used. Computer-based signal processing (separate from the acquisition system) reduces cost, allows for easy processing power, and minimizes measurement system control problems.
The standard capabilities of this analyzer can be upgraded with a wide range of options and optional accessories. For a complete list of extension options, see Options and accessories, as well as in the section Documentation.
Need more functionality? Watch the series Tektronix RSA500A.
Would you like to consider similar analyzer? Watch the series Aaronia SPECTRAN V6.
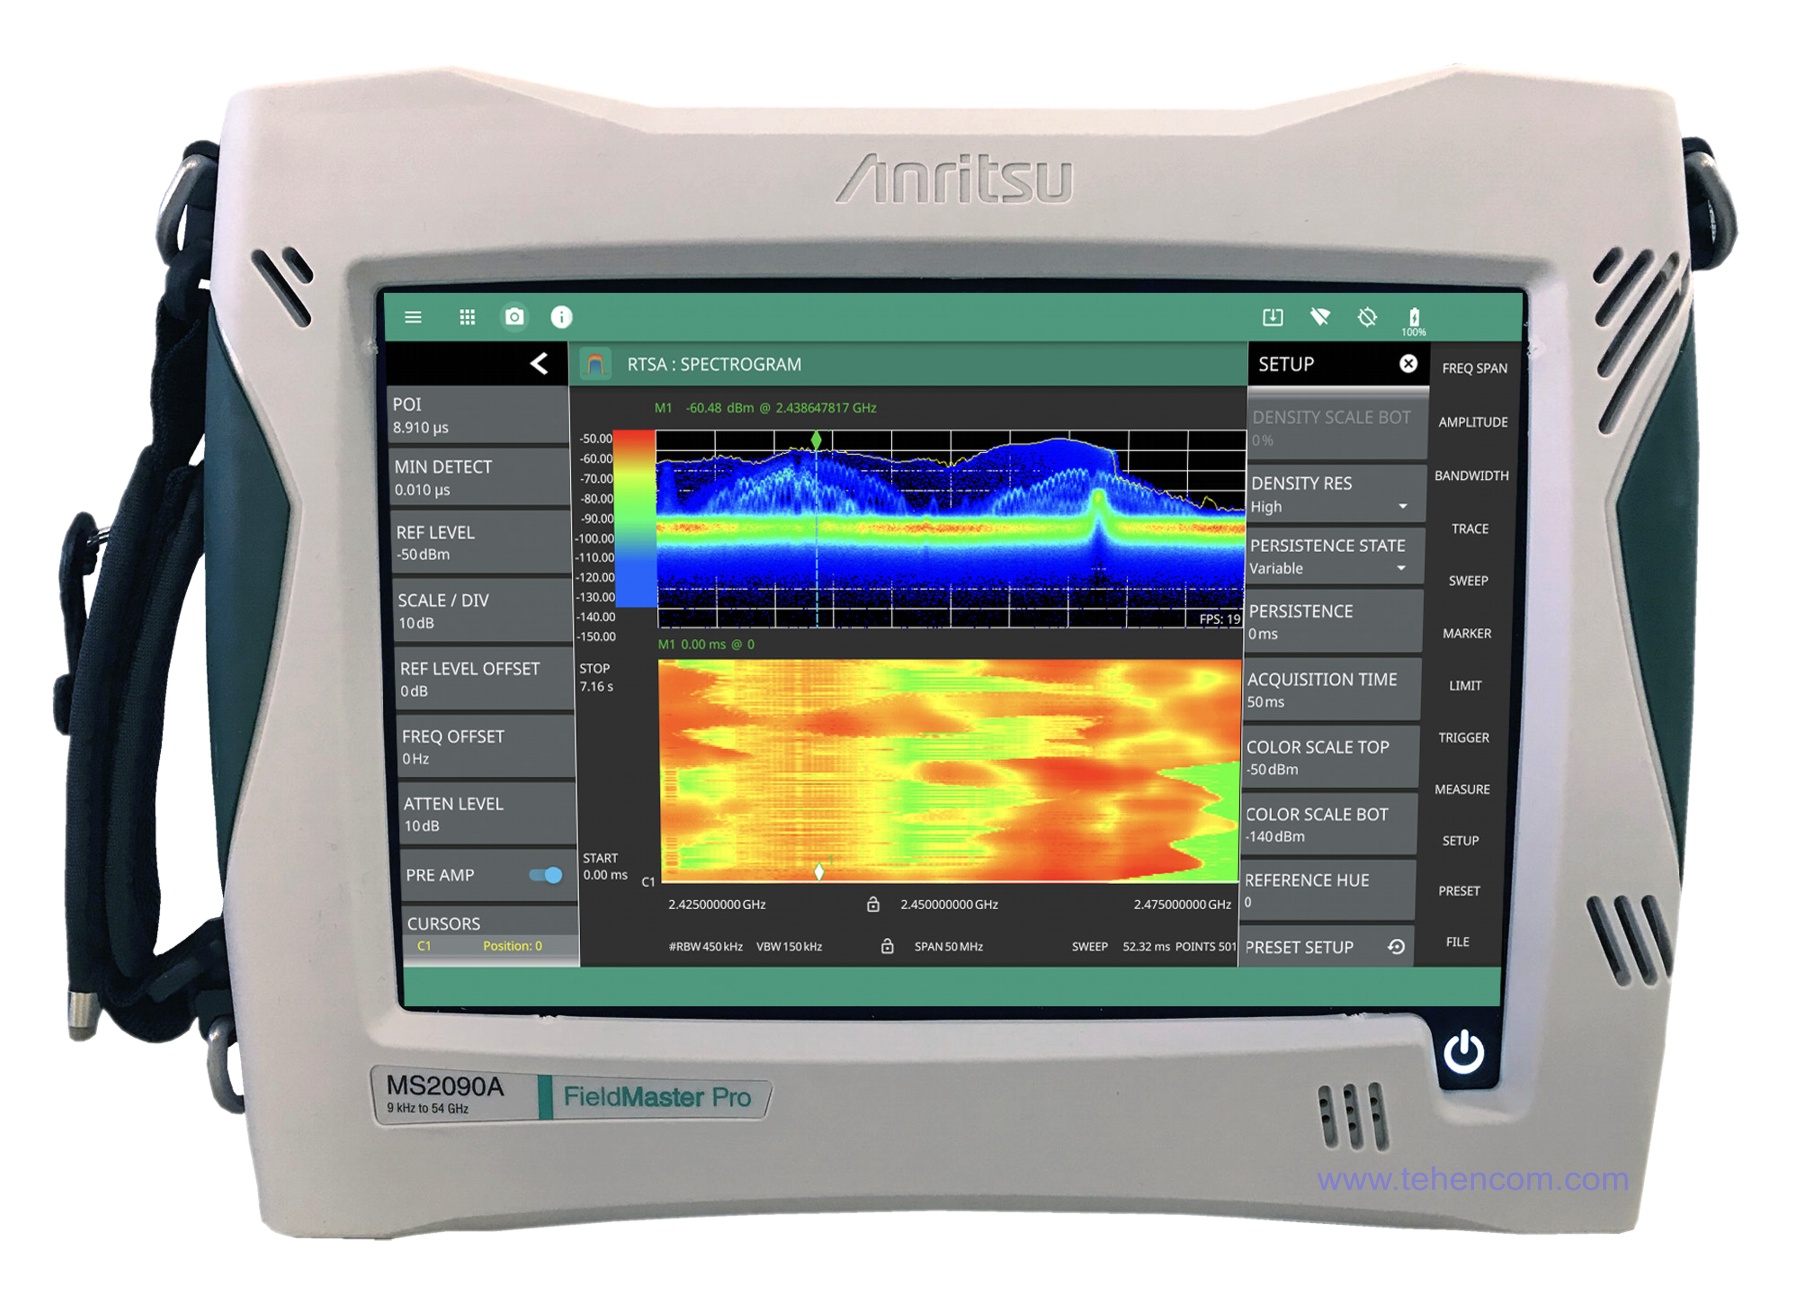
Need spectrum analyzer up to 54 GHz? Watch the series Anritsu MS2090A Field Master Pro.
Need an analyzer with maximum performance? Watch the series Tektronix RSA5000B.
Need classic spectrum analyzer? see model Anritsu MS2713E.
Want to compare all analyzers? See Spectrum analysis main page.
Video review of Tektronix RSA306B and two more series of analyzers
This story shows three main series of spectrum analyzers, signals and antenna-feeder devices from the American company Tektronix. In it you will see the functional and design features of the series analyzers RSA306B, RSA500A and RSA600A, as well as several typical applications of these devices.
Tektronix RSA306B analyzers with SignalVu-PC software
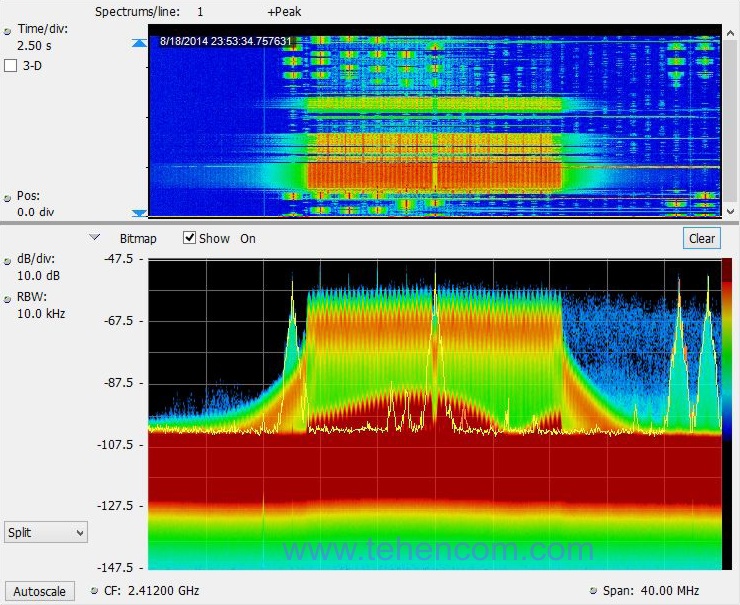
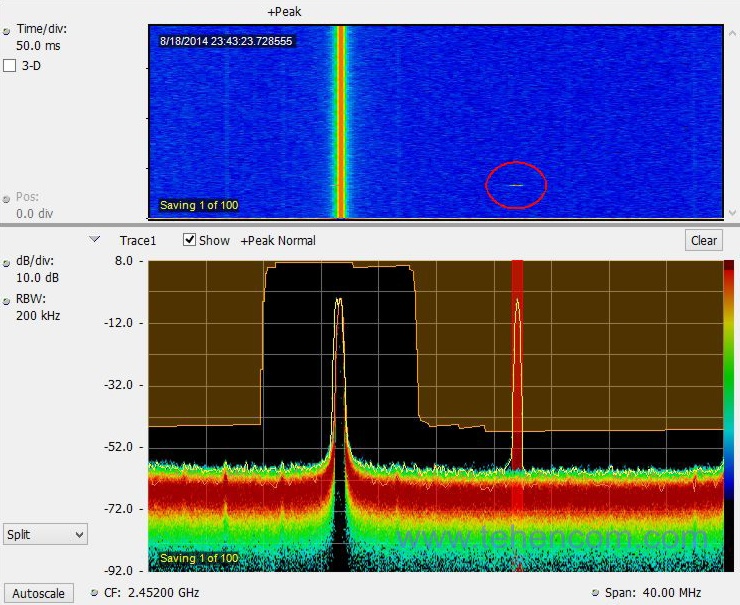
With this analyzer you will see what was previously impossible. The RSA306B real-time spectrum analyzer with 40 MHz analysis bandwidth, using the powerful computing capabilities of SignalVu-PC software, allows you to deeply investigate any signal with a duration of 100 µs. The following screenshot shows WLAN signals (green and orange) as well as Bluetooth test signals as narrowband repeating signals. The spectrogram (upper part of the photo) clearly shows the changes in signals over time, which allows you to clearly distinguish any interfering signals and interference.
Monitoring has never been so easy
Spectrum mask testing allows you to explore in detail using Tektronix RSA306B transients in the frequency domain, associated, for example, with rarely occurring interference. A mask mismatch can be used as a condition to stop capturing, remember the collected data and screen image, and sound an alert. The following screenshot shows a spectrum mask (orange in the spectrum screen) created for monitoring over a given frequency range. One outlier of 125 µs duration is shown in red. This transient process is clearly visible on the spectrogram above the mask violation area marked in red (circled in red).
Transient detection and measurement
As you know, compared to classical spectrum analyzers, real-time spectrum analyzers (Real Time) have a number of advantages in the analysis of short signals and fast transients. This video demonstrates the ability of the Tektronix RSA306B analyzer to detect transients generated by a ±10 MHz step change in the fundamental frequency of a 2 GHz oscillator.
The video shows the Tektronix SignalVu-PC personal computer software that processes and visualizes data from a Tektronix RSA306B real-time spectrum analyzer. With these settings, the RSA306B provided guaranteed detection of fast transients and short radio signals up to 54 µs (100% POI marker: 54.0 us on the right side of the screen).
Analysis of AM, FM and PM signals
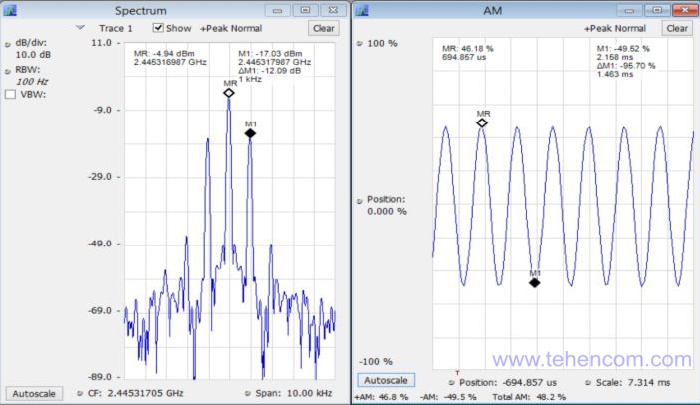
AM, FM, and PM signal analysis is standard on the Tektronix RSA306B analyzer with SignalVu-PC software. The following screenshot shows a carrier signal modulated with a 1 kHz tone (48.9% AM depth). The markers are used on the spectrum screen to measure the modulation sideband at a 1 kHz offset, 12.28 dB below the carrier level. Simultaneously, the same signal can be seen on the modulation screen showing the AM signal versus time with the measured positive peak, negative peak and modulation depth. Advanced analog audio modulation measurements, including SINAD, harmonic distortion, and modulation frequency, are available with the optional SVA option.
Measuring the quality of modulated signals
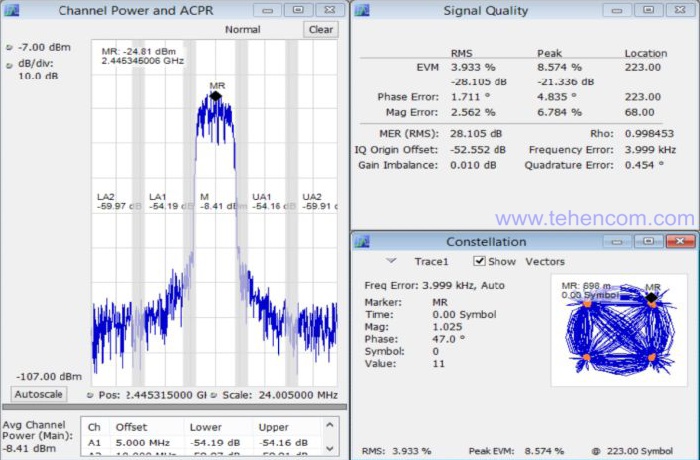
The Tektronix RSA306B spectrum analyzer with SignalVu-PC software offers a wide range of signal analysis options. The following screenshot shows a standard channel power measurement and adjacent channel leakage power with optional modulation analysis (Option SVM) to represent spectrum measurements with a constellation diagram and vector QPSK signal quality measurements.
Testing LTE signals and equipment
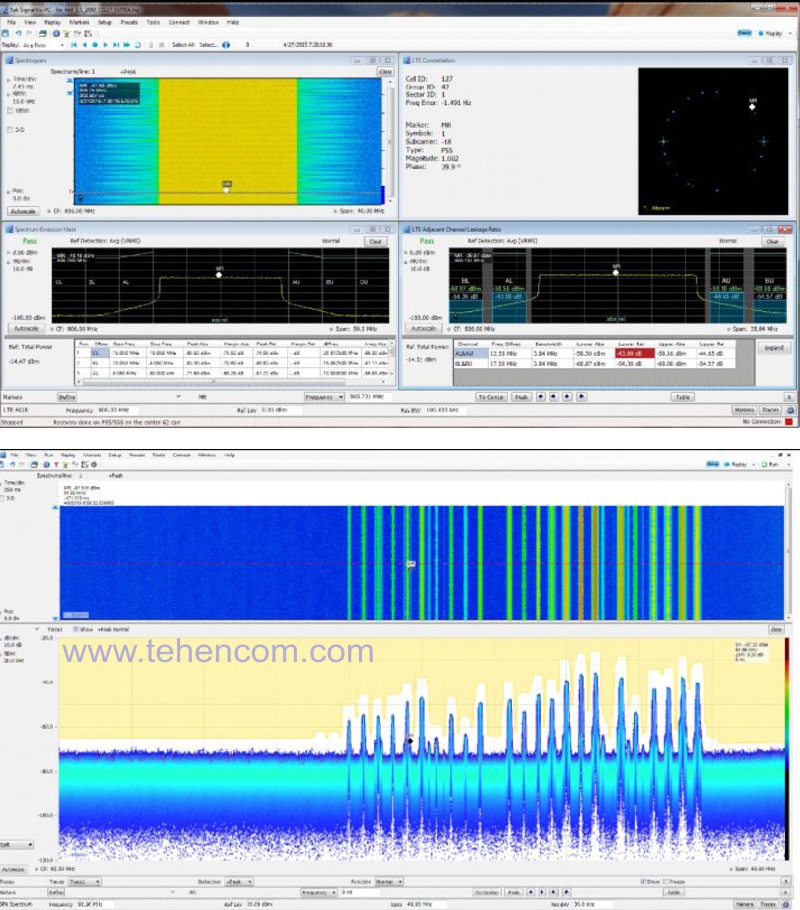
For measurement and detailed analysis, LTE is designed option SV28. It can perform base station transmitter measurements such as Cell ID, Channel Power, Occupied Bandwidth, Adjacent Channel Power Ratio (ACPR), Spectrum Emission Mask (SEM), and Transmitter Off Power for TDD. Measurements are performed in accordance with 3GPP TS version 12.5, supporting all categories of base stations, including pico and femto cells.
This photo shows two screenshots of the SignalVu-PC software, demonstrating the various measurement and analysis capabilities of LTE signals and equipment for compliance.
WLAN signal analysis
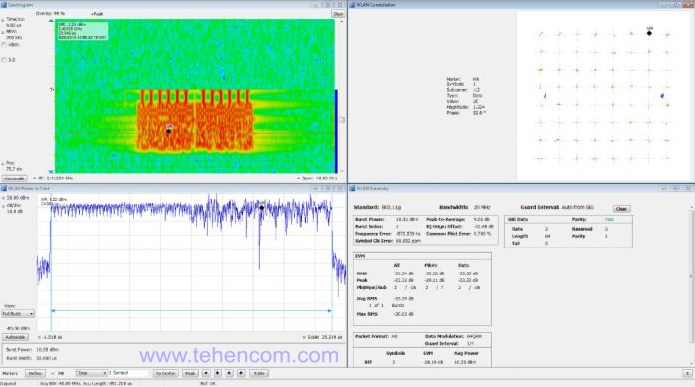
Comprehensive measurements and demodulation of WLAN signals are made easy with the Tektronix RSA306B real-time spectrum analyzer. SignalVu-PC has three options for measuring signal standards: 802.11a/b/j/g/p (option SV23), 802.11n (option SV24) and 802.11ac (option SV25) with an analysis bandwidth of up to 40 MHz. Below is a spectrogram of an 802.11g signal showing the initial control sequence followed by the main signal packets. The 64 QAM modulation automatically detected for a burst is displayed as a constellation diagram. The summary shows an error vector amplitude (EVM) of -33.24 dB(r.m.s.) and a burst power of 10.35 dBm.
Testing Bluetooth signals and equipment
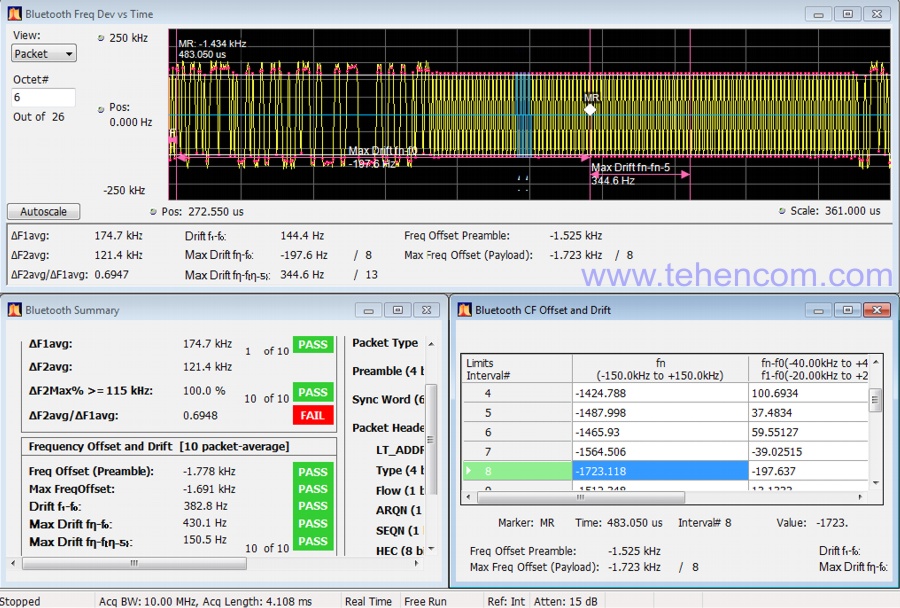
For measurement and detailed analysis of Bluetooth in the time and frequency domain, as well as in the modulation domain, option SV27. With it, you can perform Basic Rate and Low Energy Transmitter measurements in accordance with the specifications: Bluetooth SIG RF.TS.4.1.1 and RF-PHY.TS.4.1.1. In addition, Enhanced Data Rate packets can be automatically captured, demodulated, and detailed information obtained from them. For clarity, the data packet fields in the Symbol Table are color-coded.
Also, the SV27 option allows you to test Pass / Fail according to predetermined criteria. The photo below shows the measurement of time deviation, frequency offset and drift, as well as the main measurement results with color indication Pass / Fail.
Search for interference sources with their mapping
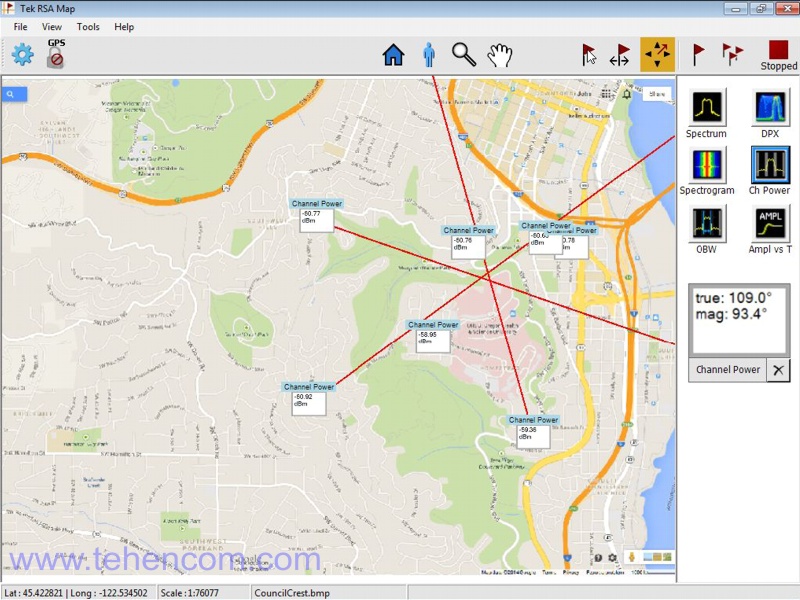
MAP option for the Tektronix RSA306B analyzer with SignalVu-PC software allows you to search for sources of interference and analyze their signal level. The location of the interferer is defined as a function of azimuth. This gives you the opportunity to indicate the direction of the antenna on the map with a line or arrow based on several measurements and, thus, find the source of the signal. You can also create and display measurement labels.
Types of measurements (standard and paid) of the SignalVu-PC program
Tektronix RSA Series Spectrum Analyzers (RSA306B, RSA500A etc.) are supplied with the control program SignalVu-PC which is installed on the computer. As standard, the SignalVu-PC software can perform more than fifteen types of typical measurements. But by purchasing additional options, the measurement capabilities of the SignalVu-PC program can be greatly expanded.
This video, using the Tektronix RSA306B analyzer as an example, shows which types of measurements are included in the standard package and which can be purchased as an option. For a detailed description of the SignalVu-PC program, see below on this page in the section Documentation.
The most compact analyzer housing
The Tektronix RSA306B spectrum and signal analyzer, in addition to powerful functionality and low price, also has an extremely compact body, which is ideal for work both in the laboratory and outside, at remote sites and on the street.
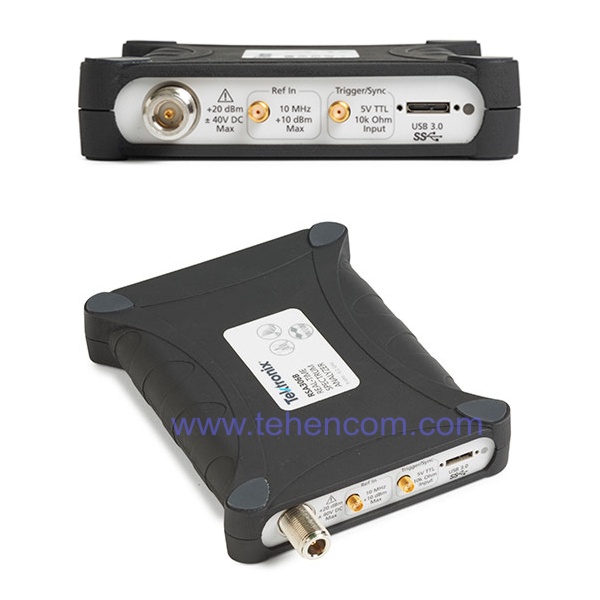
The RSA306B analyzer is equipped with four connectors:
- microwave input (N type connector);
- external reference frequency input (SMA type connector);
- external trigger input (SMA type connector);
- USB 3.0 connector with latches for connecting the spectrum analyzer to a computer or tablet.
Tektronix RSA306B analyzer specifications
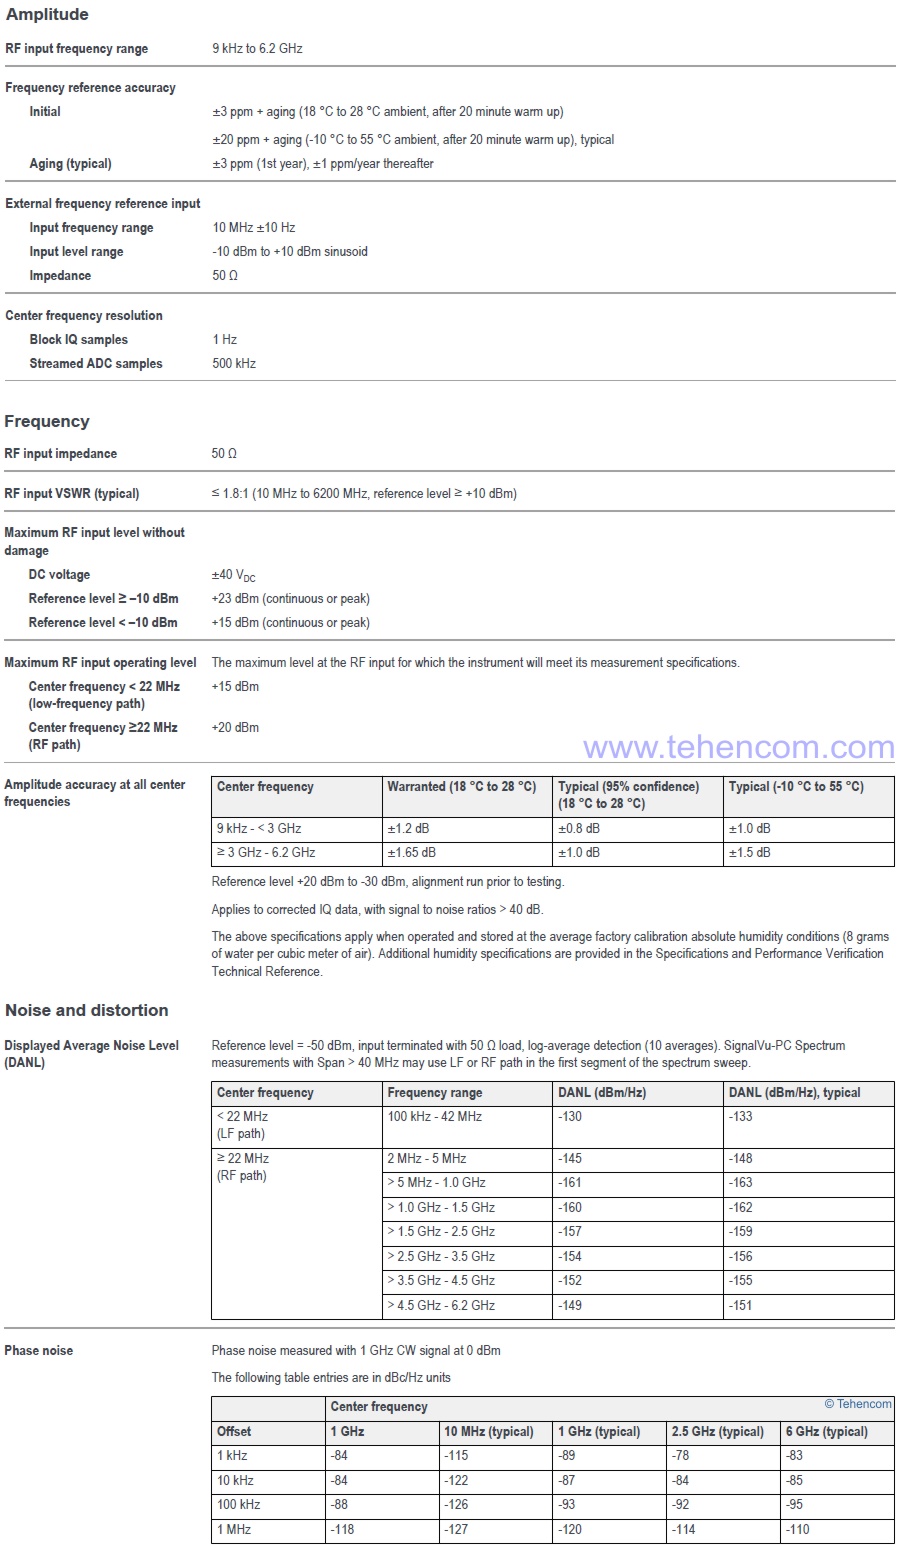
For a complete list of technical specifications for the Tektronix RSA306B handheld real-time spectrum analyzer, see Documentation.
Tektronix RSA306B analyzer package contents
| Name | Short description |
| Tektronix RSA306B | USB spectrum and signal analyzer (9 kHz - 6.2 GHz). 40 MHz real-time capture bandwidth. The RSA306B spectrum analyzer works with a computer or tablet with a USB 3.0 port and running 64-bit Microsoft Windows 7, 8, or 10. To install the SignalVu-PC software, the computer must have at least 8 GB of RAM and 20 GB of free hard disk space. For real-time performance of the RSA306B Spectrum Analyzer, a computer with a 4th generation Intel Core i7 processor is recommended. A computer with an older processor limits real-time measurements. To record streaming data, your computer must be equipped with a drive with a write speed of at least 300 MB/s. |
| 174-6796-xx | USB 3.0 cable (1m) |
| 063-4543-xx | SignalVu-PC software, documentation, USB stick |
| 071-3323-xx | Printed Installation and Safety Guide (English) |
| - | 1 year warranty (can be extended to 3 and 5 years) |
Tektronix RSA306B analyzer options and accessories
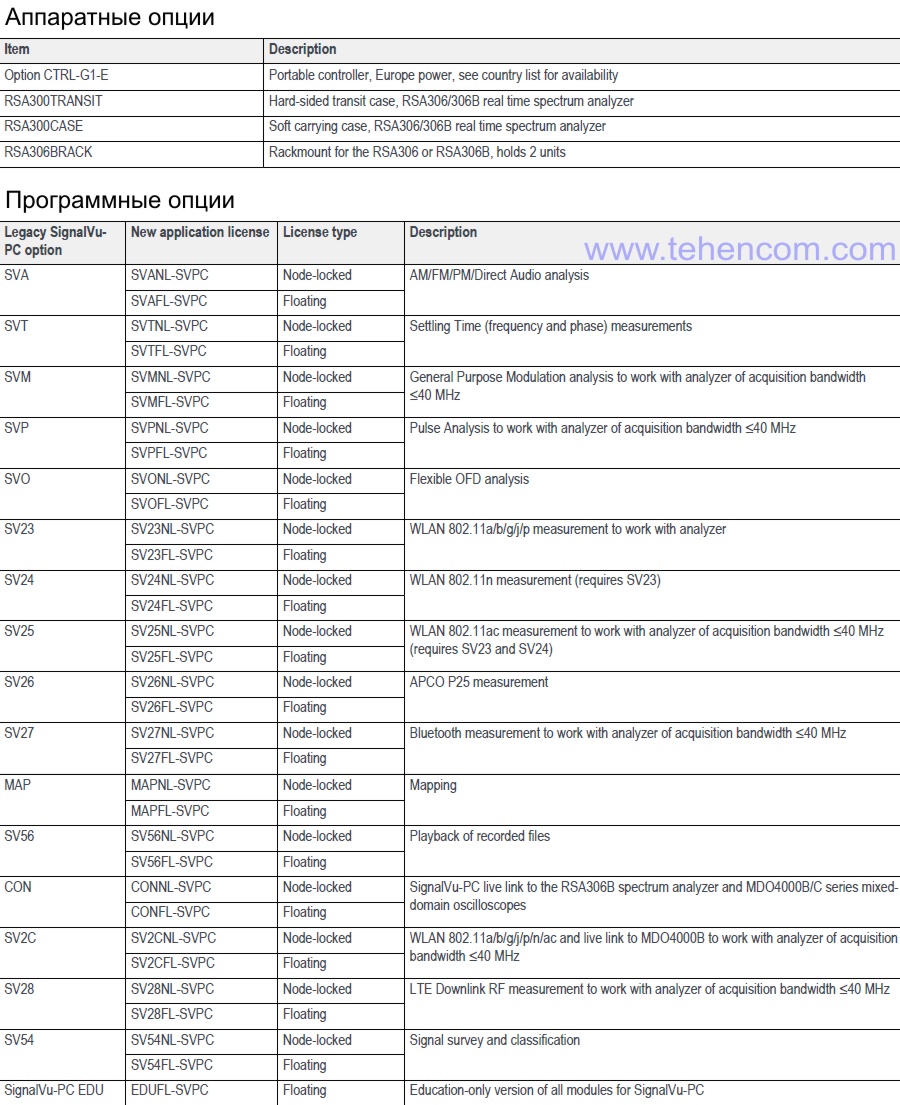
Below is a list of the main options and optional accessories for the Tektronix RSA306B spectrum analyzer and SignalVu-PC control software. For a complete list of options with a detailed description, see this page in the section Documentation. In addition, you can choose additional equipment from the following sections of our website: Measuring antennas and RF and microwave accessories.
Documentation
This PDF documentation contains the most complete description of the Tektronix RSA306B features, specifications and modes of operation:
Tektronix RSA306B real time spectrum analyzer description (in English) (26 pages; 2 MB)
Tektronix SignalVu-PC signal analysis software description (in English) (30 pages; 2 MB)
Tektronix SignalVu-PC user guide (in English) (944 pages; 40 MB)
And here you can find our tips and other useful information on this topic:
Basic theory for spectrum analysis and signal analysis
How to buy equipment cheaper – discounts, special prices, demo and used devices
To simplify the process of choosing a spectrum and signal analyzer, you can use our experience and recommendations. We have over 20 years of practical supply experience and can immediately answer many questions about models, options, delivery times, prices and discounts. This will save your time and money. For this it's simple call us or write to us at E-mail and we will be happy to answer your questions.


