Oscilloscopes with digital phosphor technology (DPO)
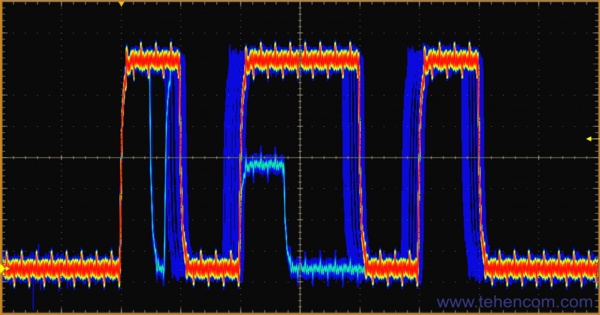
Brief introduction
Digital phosphor technology, also referred to as digital phosphor technology, is found in mid- to professional-grade oscilloscopes. In English literature, it is called DPO (Digital Phosphor Oscilloscope). Oscilloscope models based on DPO technology significantly outperform classic digital storage oscilloscopes, providing developers with new, powerful tools. This article details how this technology works and what benefits it provides.
History of DPO digital phosphor technology
In the 90s, in US laboratories, one could often see a new model of a digital oscilloscope and an old analog oscilloscope that was used in conjunction with a digital oscilloscope on the same table. Why couldn't a digital oscilloscope completely replace an analog one? The fact is that the screen of an analog oscilloscope is covered with a phosphor containing phosphorus. After the passage of an electron beam on such a screen, the trace from it does not go out instantly, but fades smoothly in a fraction of a second. That is, the screen of an analog oscilloscope has a slight afterglow.
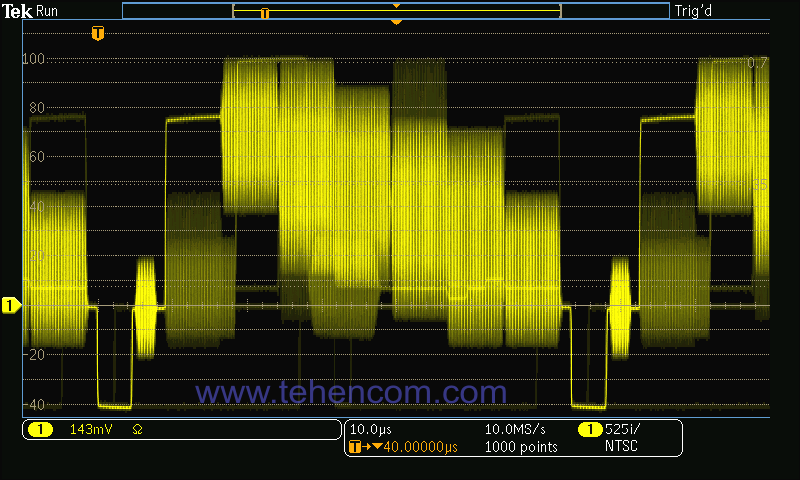
This afterglow effect made it possible to visually observe rarely occurring events and various anomalies against the background of a stationary periodic signal. Also on the screen of an analog oscilloscope, the structure of repetitive non-stationary processes, such as television signals, was clearly visible. And digital oscilloscopes could not cope with such tasks. The waveform of the TV signal is shown below.
On the other hand, digital storage oscilloscopes could store waveform samples, post-process them, and perform complex calculations on them. Digital oscilloscopes were well suited for analyzing periodic signals, recording and viewing digital sequences, recording single events and automatically calculating signal parameters such as rise time, amplitude, frequency, duty cycle, etc.
But with the advent of DPO technology, the situation has changed dramatically. Oscilloscopes based on this technology have not only been able to completely replace analog and conventional digital oscilloscopes, but also added powerful new tools to the developer's arsenal. To better understand DPO technology, let's first look at the design of a classic digital storage oscilloscope.
Structure of a classic digital storage oscilloscope (DSO)
A conventional digital storage oscilloscope in English literature is called DSO (Digital Storage Oscilloscope). DSO oscilloscopes are well suited to work with periodic, unchanging signals (sines, squares, etc.). You can also use these oscilloscopes to capture and view single events such as long digital sequences or transients. Since the signal information is digitized and stored in the DSO memory as an array of values, the signal can be easily analyzed, printed, or processed in any other way, both in the oscilloscope itself and on an external computer. However, these instruments do not display the gradations of the signal sweep in real time, so DSOs are unable to visualize changing "live" signals.
The reasons for the shortcomings of DSO oscilloscopes lie in their architecture. The figure below shows the structure of a typical digital storage oscilloscope. After the oscilloscope's trigger system is triggered, the input signal begins to be digitized by the ADC and the digitization results are placed in the sample memory. After a short period of time, which depends on the capabilities and settings of the oscilloscope (memory size, sampling rate, sweep settings, etc.), signal digitization process stops and the processing of the array of digitized values using the microprocessor begins. After some time, which depends on the speed of the microprocessor and the amount of data, the signal image is displayed. After that, the launch system is turned on again and the whole cycle repeats.

Main disadvantage such a structure is to stop the digitization of the input signal for the duration of processing the values already stored in the memory. Typical DSO oscilloscope more than 99% of the time completely ignored input signal and only processes and displays the last digitized fragment. In practice, this leads to the impossibility of detecting many types of anomalies, or the need to wait a long time until the anomaly sooner or later falls into the short interval of active digitization of the input signal.
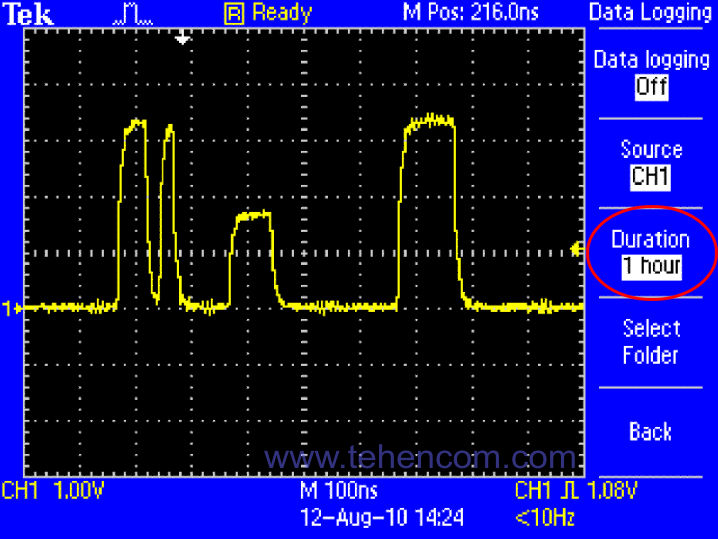
This screenshot shows a 1 µs signal fragment captured by a conventional DSO series oscilloscope. Tektronix TDS2000. In this fragment, a digital sequence signal glitch was found and, to the right of it, a signal runt. Pay attention to the long search time for this anomaly (circled in red oval) - 1 hour (1 hour). There is one more point: in order to set up an oscilloscope to trigger on the detection of such an anomaly, it is necessary to at least approximately know its amplitude and duration. Otherwise, the launch may simply not work.
The main advantage of such a structure is the possibility of using weak microprocessors and auxiliary digital circuits, which leads to a low cost of the device. Therefore, the bulk of digital storage oscilloscopes in the lower price segment are arranged in this way. And now let's look at the structure of oscilloscopes with DPO technology.
Digital Phosphor Oscilloscope (DPO) Structure
While DSOs use serial processing technology to capture, display, and analyze signals, DPOs (Digital Phosphor Oscilloscopes) use parallel processing. DPO oscilloscopes are based on a specialized FPGA (Programmable Logic Integrated Circuit) that processes the digitized values of the input signal in real time. This approach significantly increases the likelihood of detecting fast phenomena occurring in digital and analog systems, such as broken pulses, glitches, and various transients, and also provides additional analysis capabilities. The structure of an oscilloscope with DPO digital phosphor technology is shown in this figure.

While analog oscilloscopes use the physical properties of the phosphor (its inertia or afterglow), DPO oscilloscopes use electronic digital phosphor (Digital Phosphor) technology, which is actually a continuously updated database of digital data. This database has a separate memory cell for each pixel instrument display. These memory cells contain information about the current signal intensity at all points on the screen. After each capture run, the results of the current signal sample update the cells of the digital phosphor database. Thus, intensity information accumulates more in those cells through which the signal passes most often. As mentioned above, all this complex computational work is performed by a separate chip in real time, minimizing any delays.
To illustrate how this works, let's say the oscilloscope screen has 11 dots horizontally and 10 dots vertically. In such a case, the digital phosphor data table also has dimensions of 11x10 cells. Graphically, it is shown in the figure below. Now imagine that the oscilloscope has completed 9 runs of the test waveform. The signal each time had a slightly different shape. Information about the number of signal passages through each point of the screen was stored in a table of values. The signal passed through some points all 9 times, and through the rest from 0 to 8 times. The resulting digital phosphor datasheet from this example is shown in the figure. It allows you to clearly distinguish areas through which the signal passed frequently, from areas where it appeared sporadically.

In a real oscilloscope built using DPO technology, the table that stores the number of signal passes through each point contains hundreds of thousands of values, and a specialized DPO chip updates this information at a speed of tens and even hundreds of thousands of times per second. Oscilloscope series Tektronix DPO2000 provide update speed up to 5,000 times per second, and oscilloscopes of the older series Tektronix DPO70000 update table to 300,000 times per second. With DPO, it's easy to see the difference between a signal captured on every run and a signal captured on every 1000th run, for example.
While visualizing this stored information in the oscilloscope's memory, areas of the screen where the signal appears more often appear in more intense colors (shades of red and yellow), and areas of the screen where the signal appears infrequently appear in darker colors (shades of blue). The color scheme can be customized. You can also adjust the duration of the afterglow effect to a wide range, further increasing the possibilities of visualization and analysis.
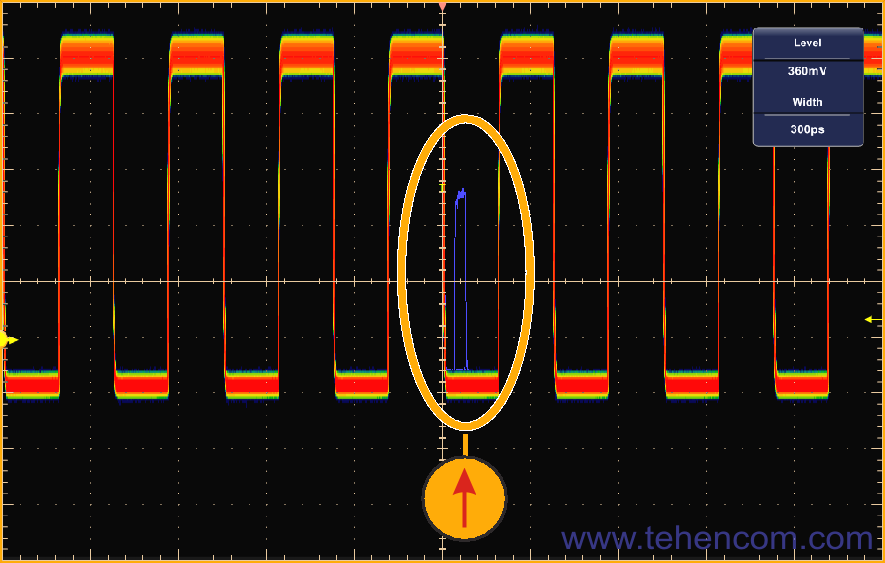
This screenshot of a DPO oscilloscope shows a digital clock signal. It is due to the effect of digital phosphor, which visually generalizes thousands of processed captures, that one can observe the range of voltage changes in the lower and upper parts of the clock sequence. And by the intensity of the color of the signal, one can judge the states in which it is located most often. Note the blue splash in the center of the screen, which is highlighted by an oval, this is a subtle clock glitch that can easily cause digital circuits to malfunction and is very difficult to catch with conventional DSO triggers, as the amplitude of the glitch is within the main signal . But thanks to DPO technology, such anomalies can be easily detected.
With DPO oscilloscopes, it is equally convenient to examine high and low frequencies, periodic signals, transients and complex signals in real time. Only DPOs have the real-time z-axis (color gradation on display) capability that conventional DSOs do not.
DPO technology is the ideal tool for those involved in the development and testing of digital and analog devices, as well as any electronic equipment. DPO oscilloscopes are excellent for advanced electronics analysis, telecom mask testing, intermittent and periodic debugging, and time-based applications.
Typical Use Cases for Digital Phosphor Technology (DPO)
There are dozens of practical problems that can be solved very effectively when using an oscilloscope with DPO digital phosphor technology. To clearly demonstrate the benefits of this technology, consider some of the most common examples.
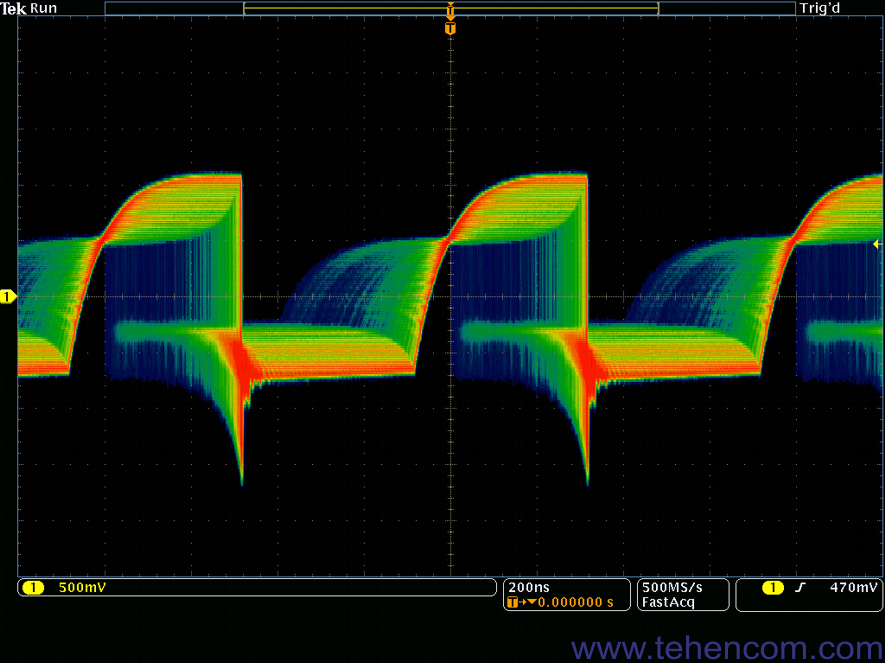
This screenshot shows a series oscilloscope screen Tektronix MDO4000C. Channel 1 trigger point set to 470 mV. On the screen, we see a signal in the range from 1 µs before the start and up to 1 µs after the start. At the same time, the results of thousands of launches are presented on the screen. That is, the statistical picture of the signal change is very detailed. As we can see from the color gradations, a small percentage of the time the signal has a reduced amplitude value - it floats, periodically decreasing by approximately two times. An oscilloscope with DPO takes less than 1 second to make such a measurement.
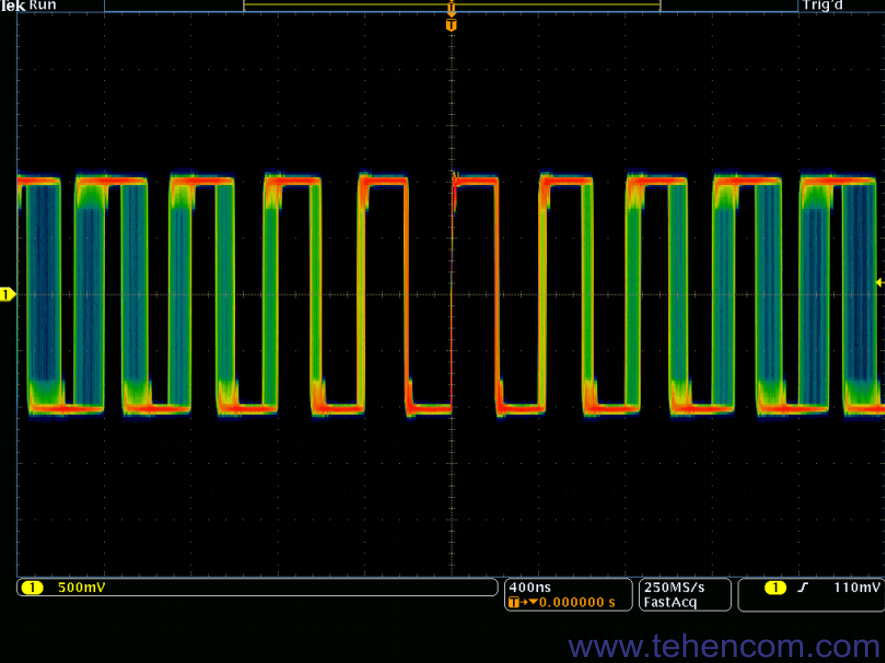
And here is another example of DPO technology in operation in the Tektronix MDO4000C series oscilloscope. In this case, the measured meander has a stable amplitude, but a floating frequency. Judging by the level of blurring of the front of the fifth from the start point of the meander period, the frequency changes by approximately 10%. Using the oscilloscope markers, you can make more accurate measurements. The oscillogram also shows a small transient process that occurs when the amplitude changes abruptly from one state to another.
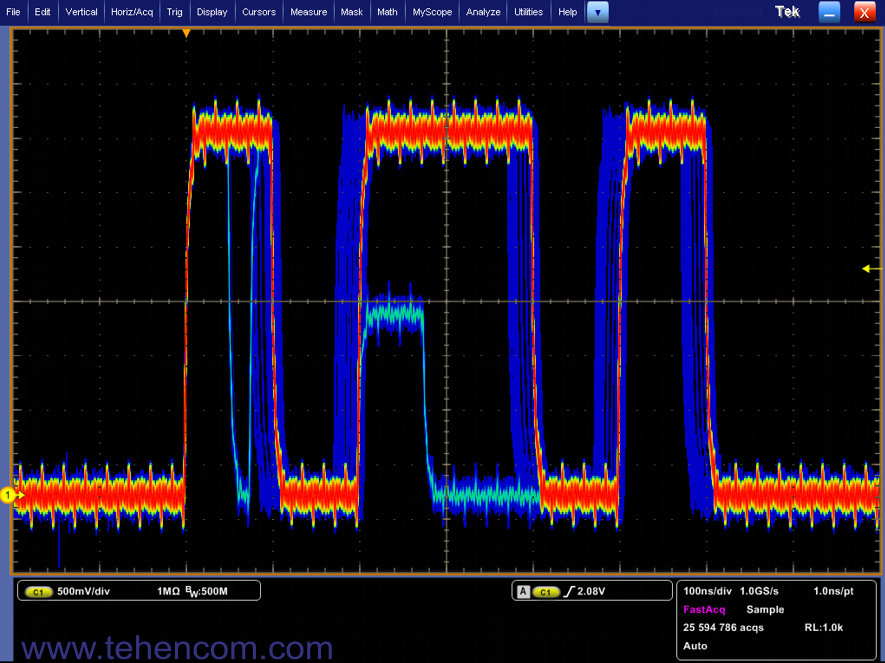
As mentioned above, DPO's digital phosphor technology is excellent at finding rare signal anomalies: glitches, runts, timing failures, and the like. In this screenshot of the oscilloscope series Tektronix DPO7000C Two signal defects are clearly visible: a short glitch at the beginning of the signal and 150 ns after the glitch, the second defect is the signal runt (a pulse that has a lower level than all other pulses in the sequence). Judging by the blue color of the glitch and welt, they occur repeatedly, but much less frequently than the main signal.
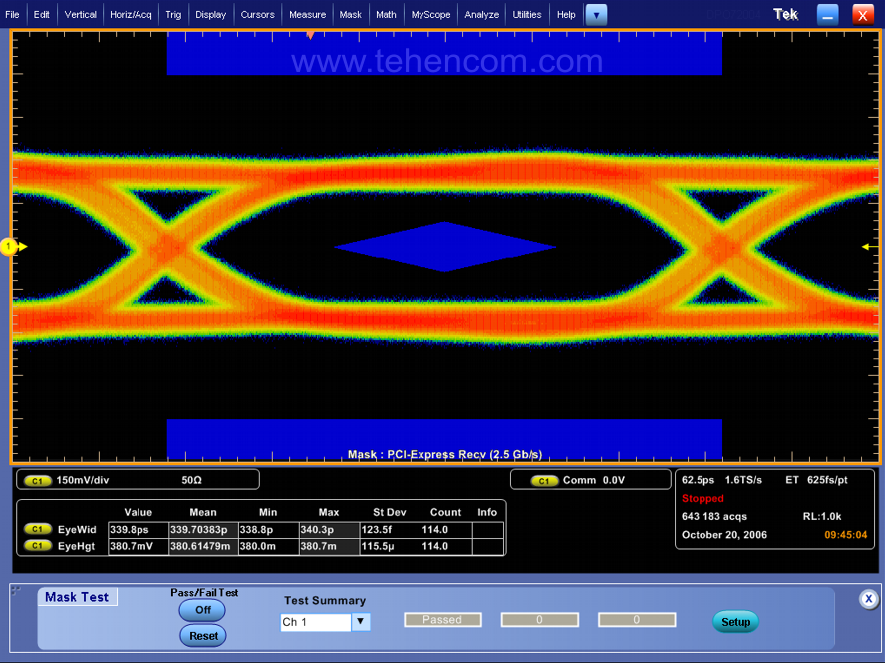
Another common application of DPO technology is in checking compliance with the waveform standards of high-speed digital interfaces: PCI Express, USB, Serial ATA, Ethernet IEEE 802.3, ANSI X3.263, Sonet / SDH, Fiber Channel, InfiniBand, Serial Attached SCSI, ITU-T /ANSI T1.102, IEEE 1394b, RapidIO, OIF Standards, Open Base Station Architecture Initiative (OBSAI), Common Public Radio Interface (CPRI), etc.
In this screenshot of the oscilloscope series Tektronix DPO70000 shows an example of testing the PCI Express bus signal. A mask is used as the compliance criteria, the parameters of which are specified in the relevant international standard. High verification confidence is achieved by analyzing hundreds of thousands of waveforms per second, which ensures that even the most subtle deviations are detected.
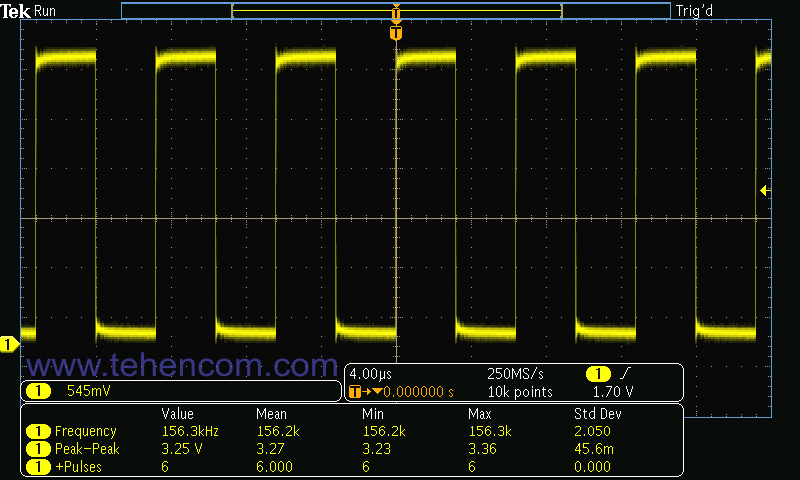
And of course the digital phosphor effect DPO can be disabled at any time. For example, when capturing and decoding long digital sequences, it is simply not needed. To do this, there is a special button or a separate menu item on the front panel of DPO oscilloscopes. This screenshot shows a series oscilloscope screen Tektronix MDO3000 with digital phosphor off. We see a "normal" meander without color gradations. Under the signal there is a table with automatically measured parameters of this meander: frequency, voltage from peak to peak and the number of positive pulses.
There are many other real-world applications where DPO digital phosphor technology greatly simplifies the developer's work and makes it more efficient. When comparing analog oscilloscope, conventional digital DSO, and DPO-enabled oscilloscope, DPO is the most versatile solution that fully provides all the features of analog and conventional digital models, plus additional powerful tools.
How to Distinguish DPO Oscilloscopes from Conventional DSOs
All oscilloscope manufacturers are aware of the benefits of DPO technology, but only a few of them include this technology in their products. Because the core of a DPO is a single, technically complex, high-performance chip, DPO-enabled oscilloscopes are more expensive and more difficult to design and manufacture. In addition, certain aspects of the implementation of DPO are protected by patents, which makes it even more difficult for most companies to release such oscilloscopes.
But the technical superiority of DPO and the enhanced capabilities that this technology puts in the hands of engineers are leading many companies to add capabilities to their regular DSO models that mimic the way DPO works. For example, by acquiring a large number of captures and then processing them in software by the microprocessor, some DSOs can display an image containing gradations in the signal color. But a full-fledged DPO oscilloscope will get such a picture in a fraction of a second, and a DSO can take minutes or even hours to acquire the same number of measurements.
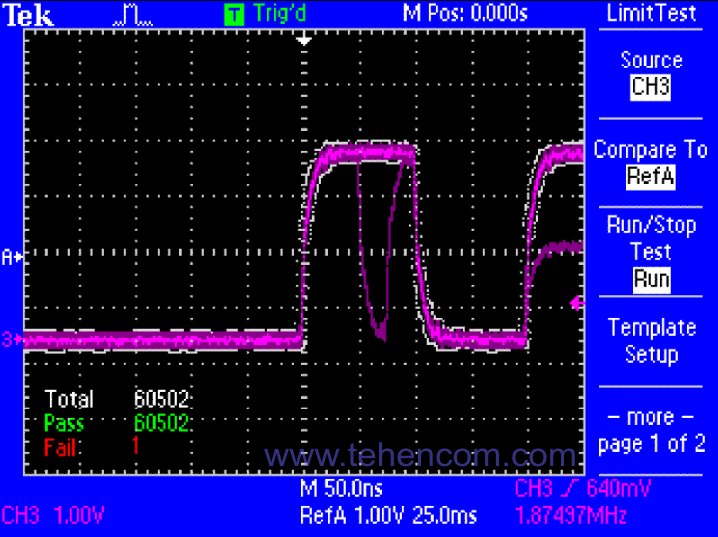
This screenshot shows the emulation of the digital phosphor effect by a conventional DSO series oscilloscope. Tektronix TDS2000C. A signal fragment with a duration of 0.5 µs contains a glitch and a part of the runt. As indicated at the bottom left of the screen, 60502 samples were collected. The signal on the screen has gradations of color, simulating the operation of a DPO, but it took hundreds of times more time to accumulate this information than a full-fledged DPO. And if the anomaly is not periodic, but single, then with a probability of 99%, the DSO oscilloscope simply will not notice it. Also, the detail of the picture is much lower than that of DPO.
Main criterion, which allows you to immediately distinguish a DPO oscilloscope from a DSO, is the speed of continuous acquisition and analysis of waveforms that a particular model can realistically provide. This parameter is specified in the technical description of the oscilloscope. If the value of this parameter is less than 1000 waveforms per second or it is not indicated at all, then you have a conventional DSO digital oscilloscope with serial signal processing. If the value of this parameter is tens and hundreds of thousands of waveforms per second, then this is a full-fledged oscilloscope with parallel signal processing using a hardware DPO chip.
If we talk about the range of oscilloscopes of the American company Tektronix, conventional DSOs include the lower series: TBS1000B and TBS2000B, as well as two series with galvanically isolated channels: TPS2000 and THS3000. They can capture and analyze up to 100 waveforms per second.
As you can see from the same table, Tektronix oscilloscopes with full DPO technology support include the following series: DPO/MSO2000, MDO3, MDO4000C, MSO4, MSO5, MSO6 and DPO/MSO70000. And to the oscilloscopes of the company Pico Technology with full support for DPO technology include the following series: PicoScope 3000D and PicoScope 6000E. Most of these models can capture and analyze hundreds of thousands of waveforms per second.
Additional information on this topic
Among the many oscilloscopes on offer, models with hardware implementation of DPO digital phosphor technology stand out for their deep signal analysis capabilities. This article describes the implementation details of DPO technology and shows typical examples of its application.
A complete list of modern digital oscilloscopes, both conventional DSO and DPO, is presented here:
All series of digital oscilloscopes
And here you can find our tips and other useful information on this topic:
How to quickly choose an oscilloscope - selection criteria, typical applications and popular models
How to buy equipment cheaper - discounts, special prices, demo and used devices
To simplify the process of choosing a digital oscilloscope, you can use our experience and recommendations. We have over 20 years of practical supply experience and can immediately answer many questions about models, options, delivery times, prices and discounts. This will save your time and money. For this it's simple call us or write to us at E-mail and we will be happy to answer your questions.