Description of the 128 division PON network simulator used to test the capabilities of optical reflectometers
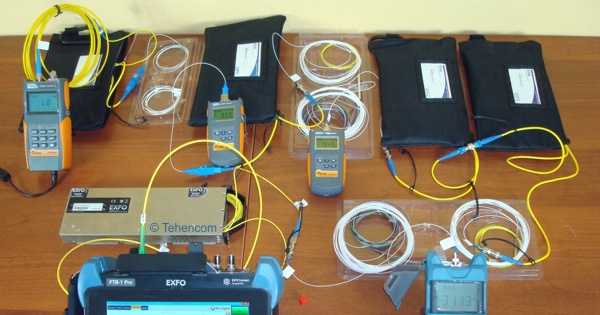
Brief introduction
Choosing an OTDR for a PON is not an easy task. After all, the PON network contains dividers (splitters), which lead to significant attenuation of the test reflectometric pulses and, because of this, represent a serious test for any model of reflectometer, even with a large dynamic range. On the other hand, PON network dividers are often located close to each other, sometimes at a distance of less than 100 meters, which further complicates the task of accurate measurement, as it requires a minimum dead zone from the reflectometer.
Manufacturers (EXFO, Anritsu, Grandway, etc.) produce many models of optical reflectometers, many of which are advertised as PON-optimized. At the same time, the cost of the proposed models ranges from $500 to $10,000. It is clear that the real capabilities of these devices differ as much as their price.
To show how difficult it is for a reflectometer to work with a PON network and help you choose the right model, we have compiled a PON network simulator with a total division factor in the branch equal to 128. On this simulator we tested five different reflectometers produced by EXFO and Grandway. The measurements were carried out with an active PON network at wavelengths of 1625 nm and 1650 nm and at inactive PON network at wavelengths of 1310 nm and 1550 nm.
PON Network Simulator Diagram
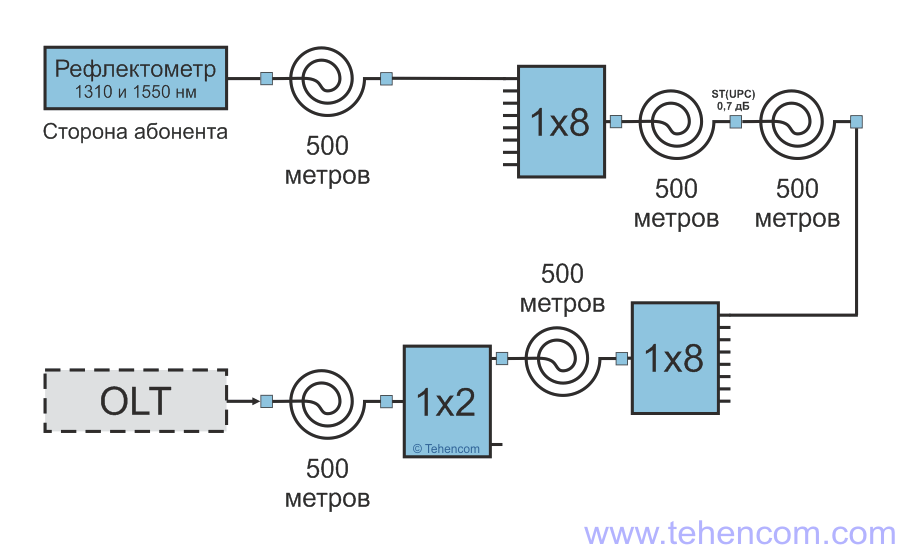
The PON network simulator contains three dividers: two dividers with a division factor of 1x8 and one divider with a division factor of 1x2. Thus, the overall division factor is 128, which is currently the maximum value for PON networks in operation. There are also a significant number of networks in operation with a maximum division ratio of 1x64, the topology of which is also provided by this simulator, since the 1x2 divider is located farthest from the reflectometer.
The main task of this simulator is to test the measurement capabilities of various optical reflectometers under conditions that are as close to real as possible. Therefore, between the reflectometer and the first divider, as well as between the other dividers, fiber segments 500 meters long are connected. And between the two 1x8 dividers, two pieces of fiber of 500 meters each are included, between which there is a connector with UPC polishing and a loss of 0.7 dB. Accurate loss measurement on this connector is one of the tests that have been performed.
In reality, the dividers can be located at smaller or greater distances than is implemented in this simulator, but it is precisely this separation of the dividers from each other that makes it possible to correctly measure the dead zone of the tested reflectometers at different measuring pulse durations. This figure shows a block diagram of a PON network simulator in the test mode for reflectometers with wavelengths of 1310 nm and 1550 nm in inactive fiber conditions (there is no signal to the far end of the fiber from the OLT side).
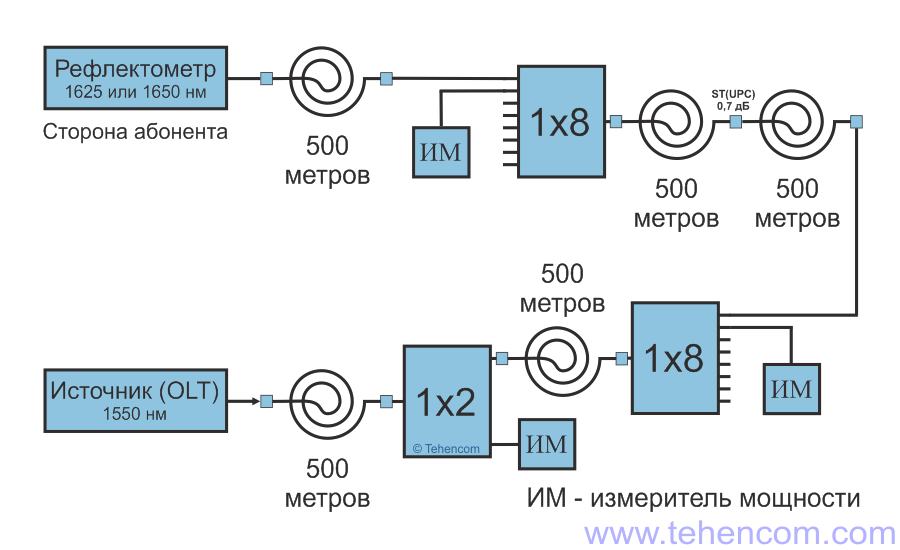
In addition to testing standard 1310 nm and 1550 nm reflectometers, we also tested several models of 1625 nm and 1650 nm reflectometers on this simulator, which are specifically designed for troubleshooting and certification of working optical networks.
To create conditions for an active fiber, an optical radiation source with a wavelength of 1550 nm was connected at the end of the simulator far from the reflectometer (on the OLT side). For instrumental control of its power at different points of the fiber, an optical power meter was connected to the second output of each divider: two manufactured by Grandway and one manufactured by EXFO (at the point with the weakest signal). The block diagram of the simulator for testing reflectometers on active fiber is shown in this figure.
Description of the main elements of the PON network simulator
The appearance of the PON network simulator is shown in the photo below. Numbers from 1 to 11 indicate its main components. Let's start the description of the components with an optical reflectometer, it has No. 1 and, when measured in a real PON network, is connected to the optical connector instead of the user equipment (ONT). In this simulator, using a short patch cord, the reflectometer is connected to a fiber spool 500 meters long, which is indicated in photo No. 2. After the five-hundred-meter coil No. 2, the first splitter is located with a division factor of 1x8. This splitter is indicated in photo #3. The coil is connected to the first of the eight outputs of the splitter, and the optical power meter EXFO EPM-50 is connected to the second output of the splitter. The remaining six outputs of the splitter are not connected.
The second splitter (divider) 1x8 is indicated in photo No. 7. Between it and the previous divider, two spools of fiber are connected, each 500 meters long. These coils are marked in photos #4 and #5. The coils are interconnected using an optical adapter No. 6. This optical adapter connects two ST(UPC) connectors, introduces an attenuation of 0.7dB and good OTDRs will need to measure it accurately.
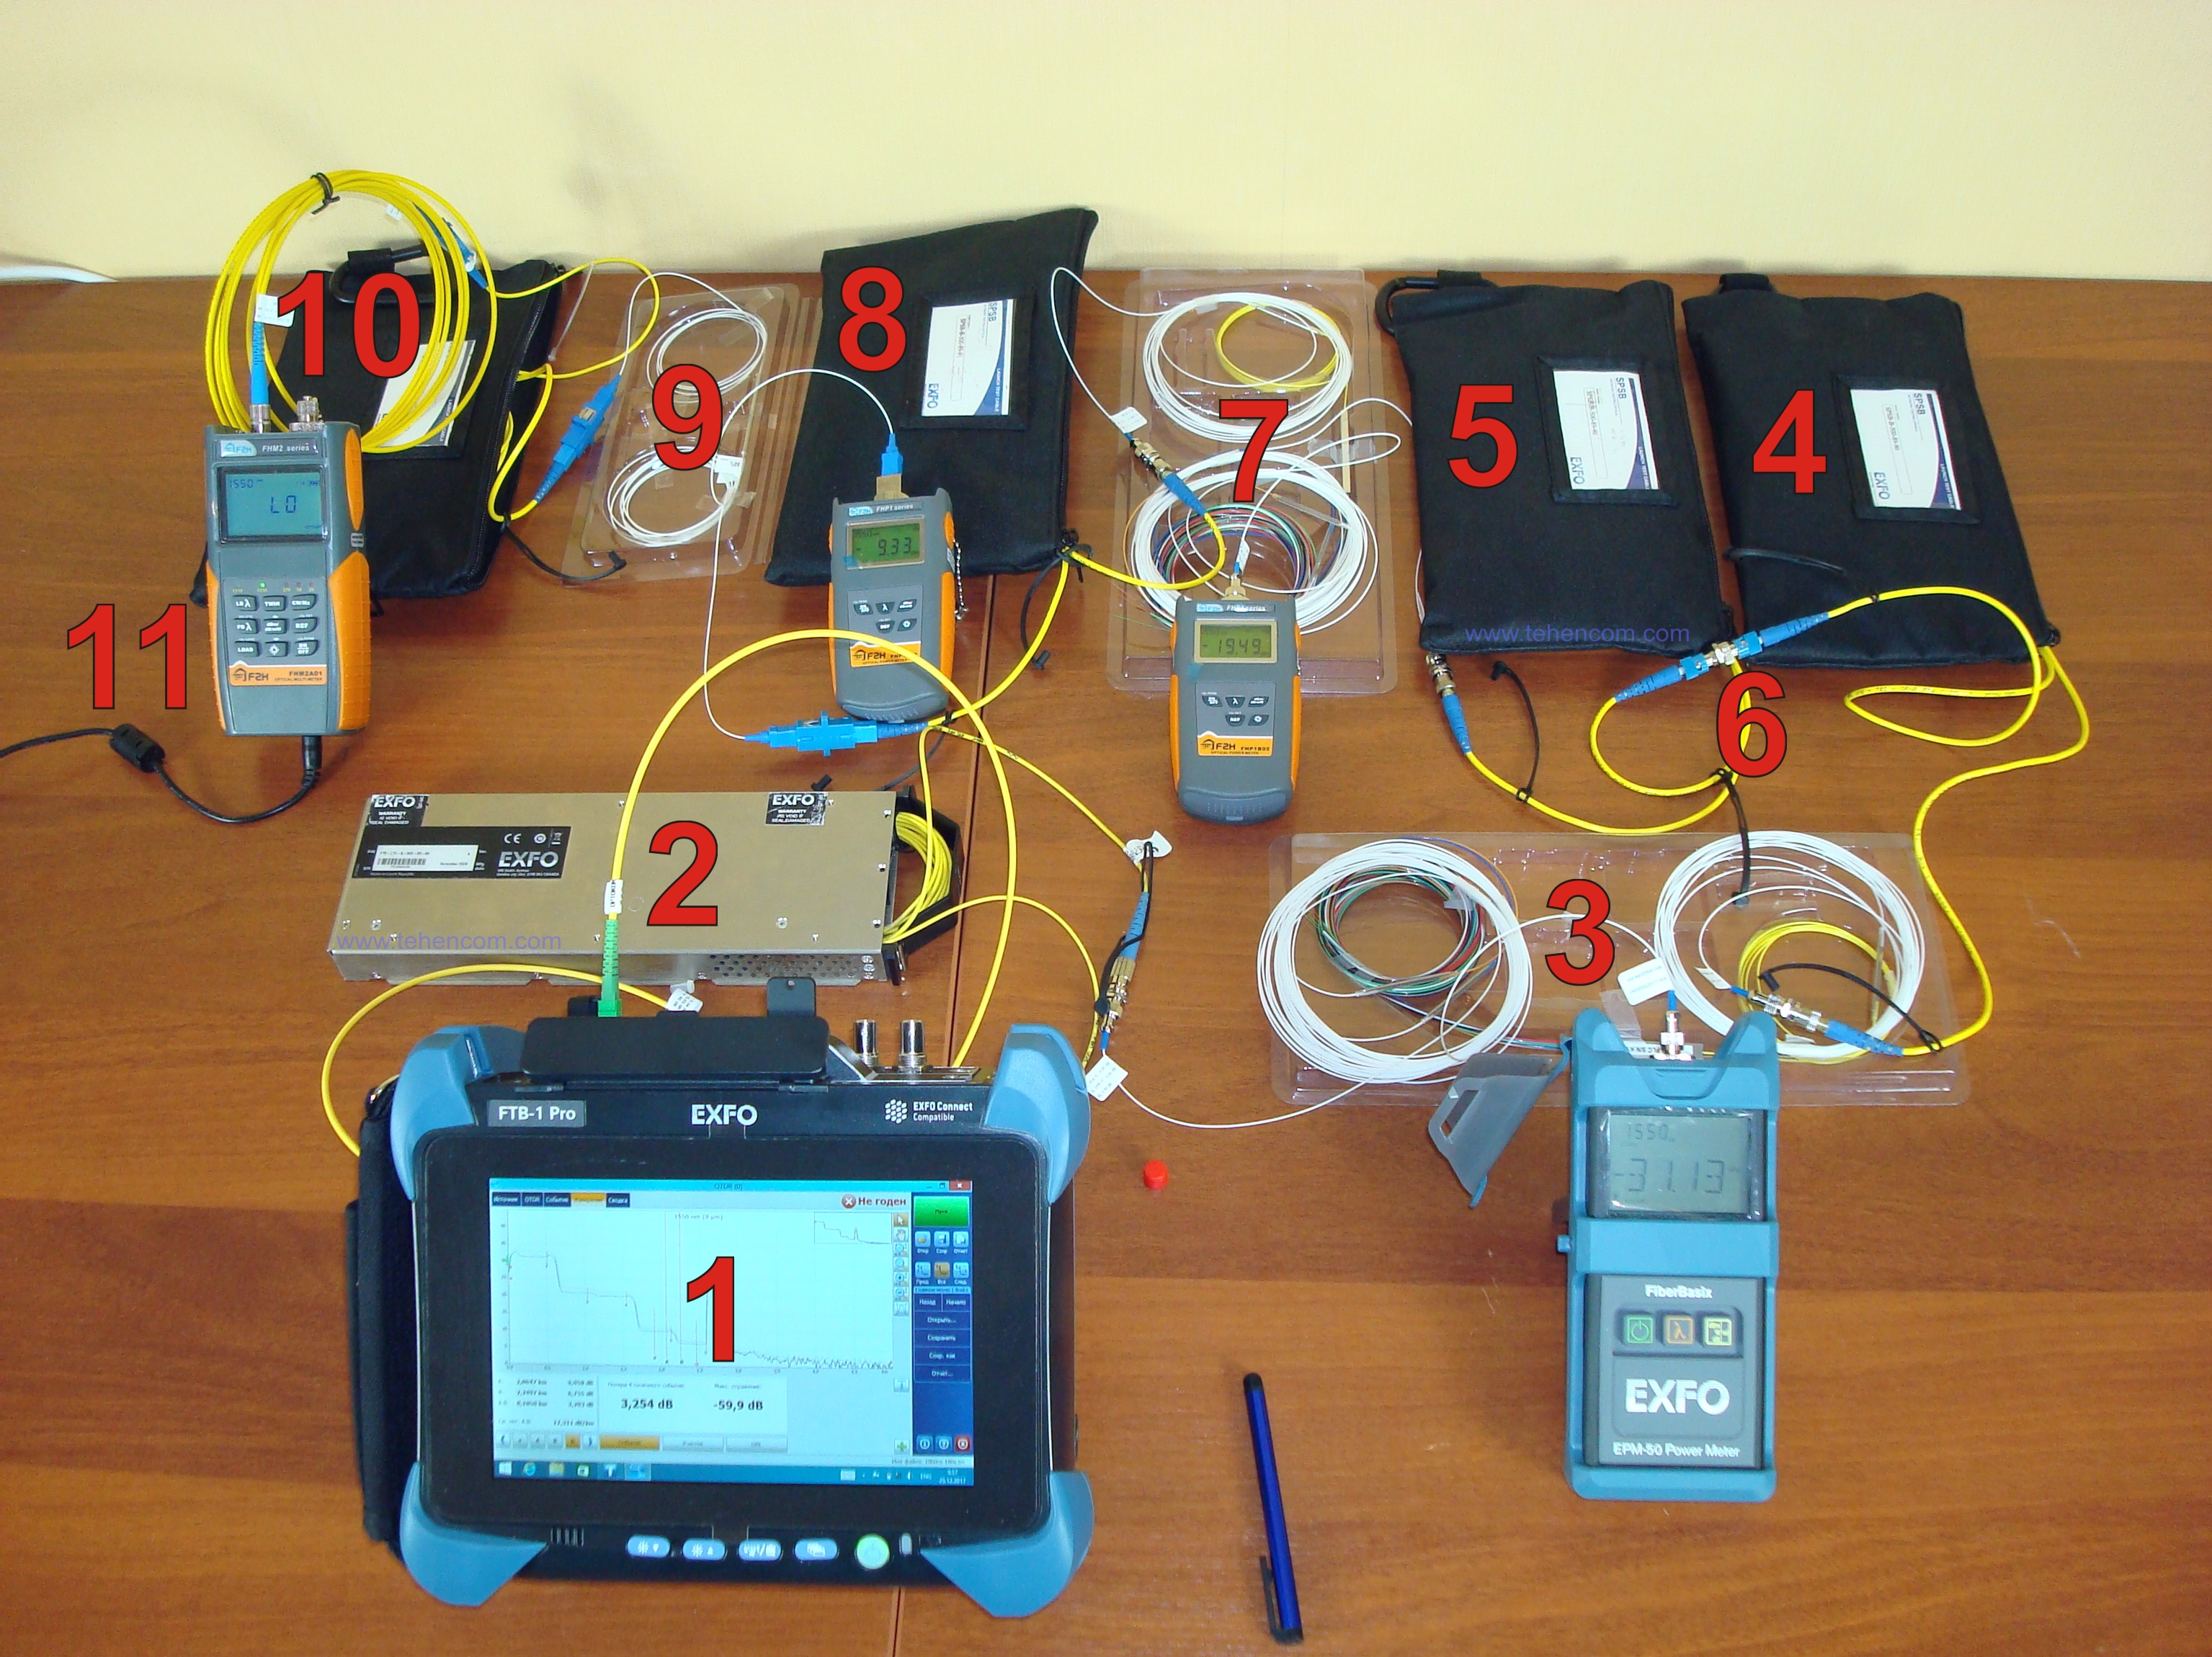
Further, the divider No. 7 is followed by another spool of fiber No. 8, also 500 meters long, immediately after which the divider No. 9 is connected with a division factor of 1x2. This divider is needed so that the total division factor is 128. At the same time, the distances between the three dividers are chosen so that when testing reflectometers it is clearly visible which models can fully measure the parameters of the PON branch with a maximum division factor of 128, and which ones will not even pull the division at 64.
Two elements complete the simulator circuit: the last spool of fiber 500 meters long under No. 10 and radiation source No. 11 with a wavelength of 1550 nm and radiation power: -5.5 dBm. This source was turned on when testing reflectometers designed to work on an active network, and turned off when testing conventional reflectometers with wavelengths of 1310 nm and 1550 nm.
Dividers (splitters)
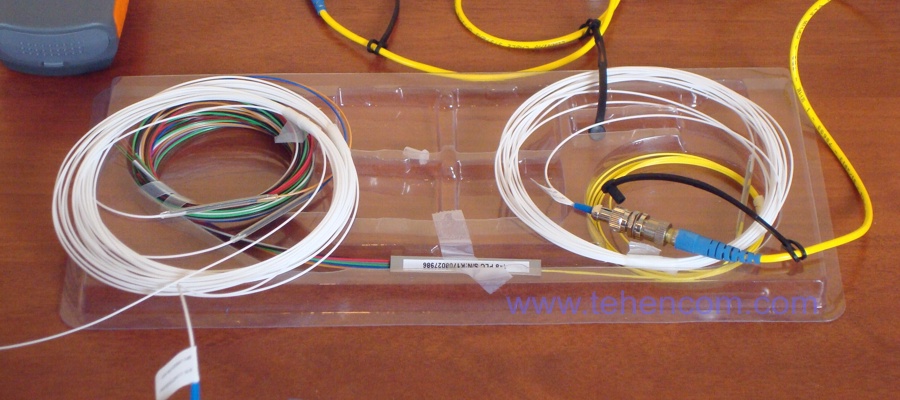
All three dividers that are used in the simulator are classic planar splitters (PLC Splitter), which are widely used in the construction of PON networks. The appearance of the first 1x8 splitter is shown in this photo. The splitter itself was supplied with unfinished fiber taps 5 meters long. We welded one and a half meter pigtails to the splitter inlet and its first and second outlets. Thus, fiber sections of 6.5 meters were added before and after the splitter, which will be visible on the reflectograms of only the best reflectometers.
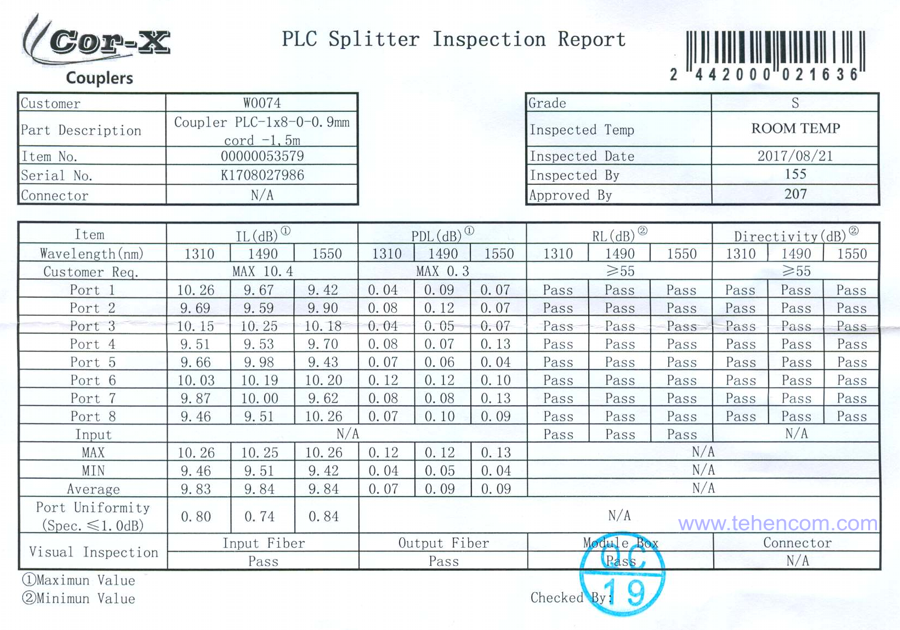
The results of factory measurements of the parameters of the first 1x8 splitter are presented in this table. Please note that the results shown are for the splitter only and do not include additional losses from welded pigtails. When analyzing the resulting traces, we are primarily interested in two numbers from this table, namely the insertion loss for port 1 at wavelengths of 1310 nm and 1550 nm. These values are respectively 10.26 dB and 9.42 dB.
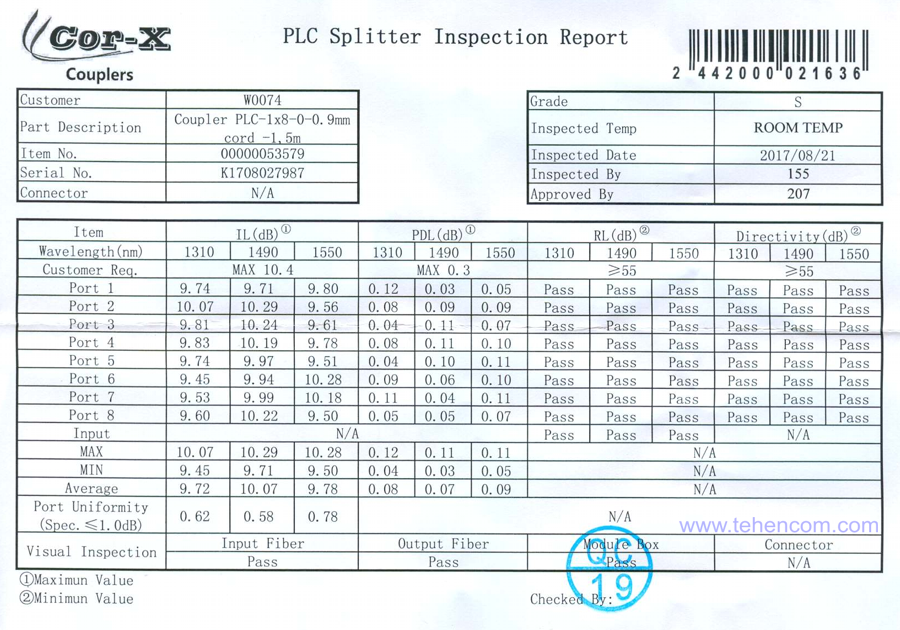
The second divider 1x8 is similar to the first. One and a half meter pigtails were also welded to it. The results of factory measurements of its parameters are presented in this table. The results shown do not include additional losses from welded pigtails. When analyzing the resulting reflectograms, we are interested in the insertion loss for port 1 at wavelengths of 1310 nm and 1550 nm. These values are 9.74 dB and 9.80 dB.
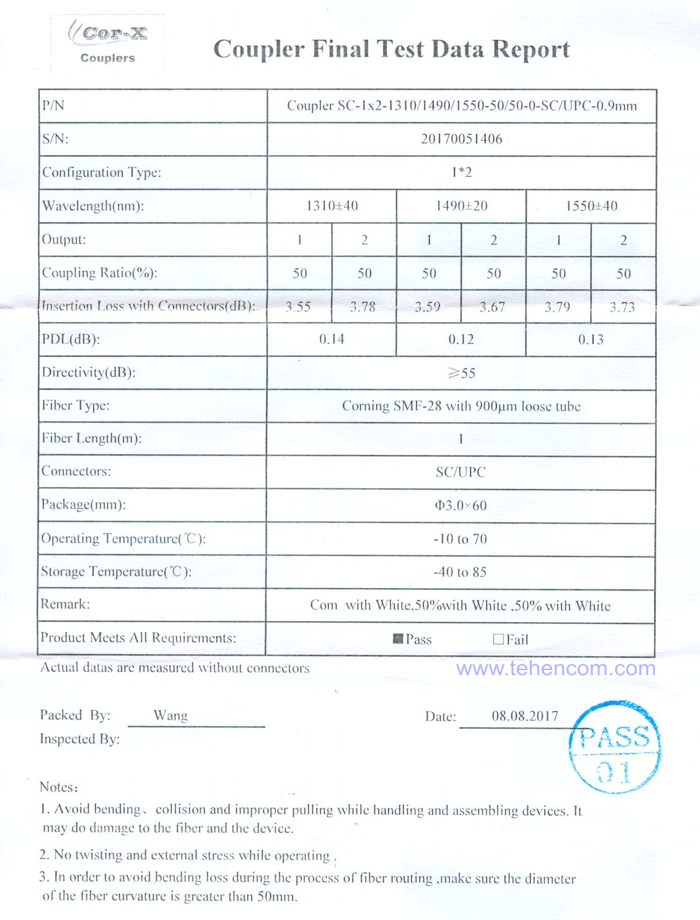
The third one-to-two divider is also planar (PLC), but was supplied with optical connectors already welded on. The results of factory measurements of its parameters are presented in the table below and combine the characteristics of the divider with the characteristics of the connectors. When analyzing the resulting reflectograms, we are interested in the insertion loss for port 1 at wavelengths of 1310 nm and 1550 nm. For the third divider, these values are 3.55 dB and 3.79 dB.
Also, when interpreting the measurement results of reflectometers, it should be remembered that optical splitters are in principle not symmetrical and attenuate the signal differently depending on whether it comes from the OLT or the subscriber.
Reflectogram of the PON network simulator
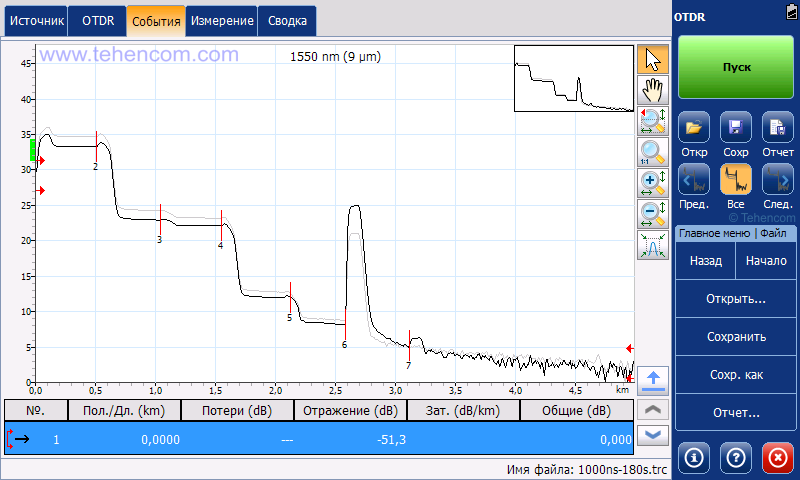
Above on this page, the design of the simulator for testing reflectometers is described in detail. And this screenshot shows its reflectogram measured at two standard wavelengths: 1310 nm and 1550 nm. This trace was obtained using a PON-optimized reflectometer with a dynamic range of 39 dB. The averaging time is 3 minutes, the pulse duration is 1 µs.
On this trace, the first 1x8 divider is located at a distance of 500 meters and is marked as event No. 2. Event No. 3 on the trace is the connection of two ST (UPC) connectors between coils of 500 meters. The loss on this event is 0.7 dB. Event #4 is the second 1x8 divider. Event #5 is the third divider with a division factor of one to two. Event #6, 2600 meters away from the OTDR, is the end of the last 500 meter spool of fiber.
Note that five spools of 500 meters add up to 2,500 meters, and the end of the fiber is at a distance of 2,600 meters on the trace. An additional 100 meters are gained due to the divider taps (6.5 meters on each side), a ten-meter patch cord, which connected the 1550 nm radiation source, and due to the fact that the actual length of the coils, together with connectors, is just over 500 meters.
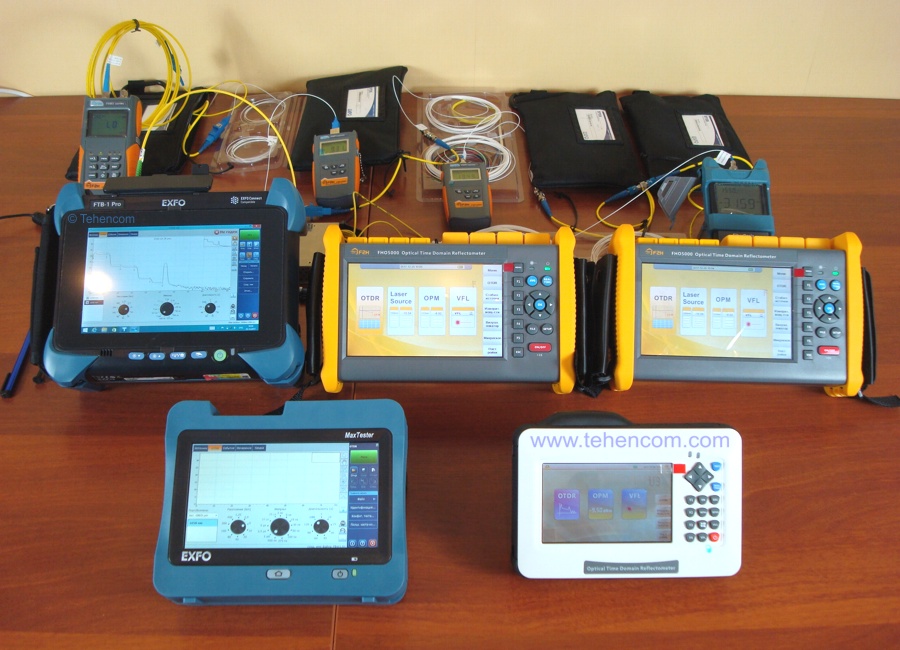
Reflectometers that took part in the test
This photo shows five OTDRs manufactured by EXFO and Grandway that were tested on the PON simulator. Their dynamic range ranges from 26 dB to 39 dB. All reflectometers have been tested at standard wavelengths of 1310 nm and 1550 nm. And two of these five models were additionally tested with active fiber, as they contained a separate measurement port with a filter and an operating wavelength of 1625 nm or 1650 nm.
During the test, reflectograms were measured with each device at all test pulse durations from 10 ns to 5 µs. The measurement time for each wavelength was 30 seconds, but separately for the optimal pulse duration, the measurement time was set to 3 minutes in order to get the highest quality reflectogram and see what each model is capable of when working with a PON network with division in the 128 branch.
Test results for 1310/1550 nm are summarized in this article. Test results for 1625/1650 nm are currently being processed and will be posted on our website in a separate article. The link to it will be here. Also on our channel YouTube two videos of active and inactive network tests will be posted. These videos show how the measurements were taken. They also clearly show how these reflectometers work, how quickly they average noise, and many other useful details.
Additional information on this topic
This page details the 128 division PON simulator. test results for 1310 nm and 1550 nm. Test results for 1625/1650 nm are being processed. We also recommend that you read the article about principle of operation of an optical reflectometer, which describes how it works, provides detailed recommendations for choosing the initial settings and taking measurements. And to better navigate the models of modern optical reflectometers and their capabilities, see the main page individual series of optical reflectometers.
If you need detailed pricing information or technical advice on choosing the best OTDR for your application, just call us or write to us at E-mail and we will be happy to answer your questions.